User interface
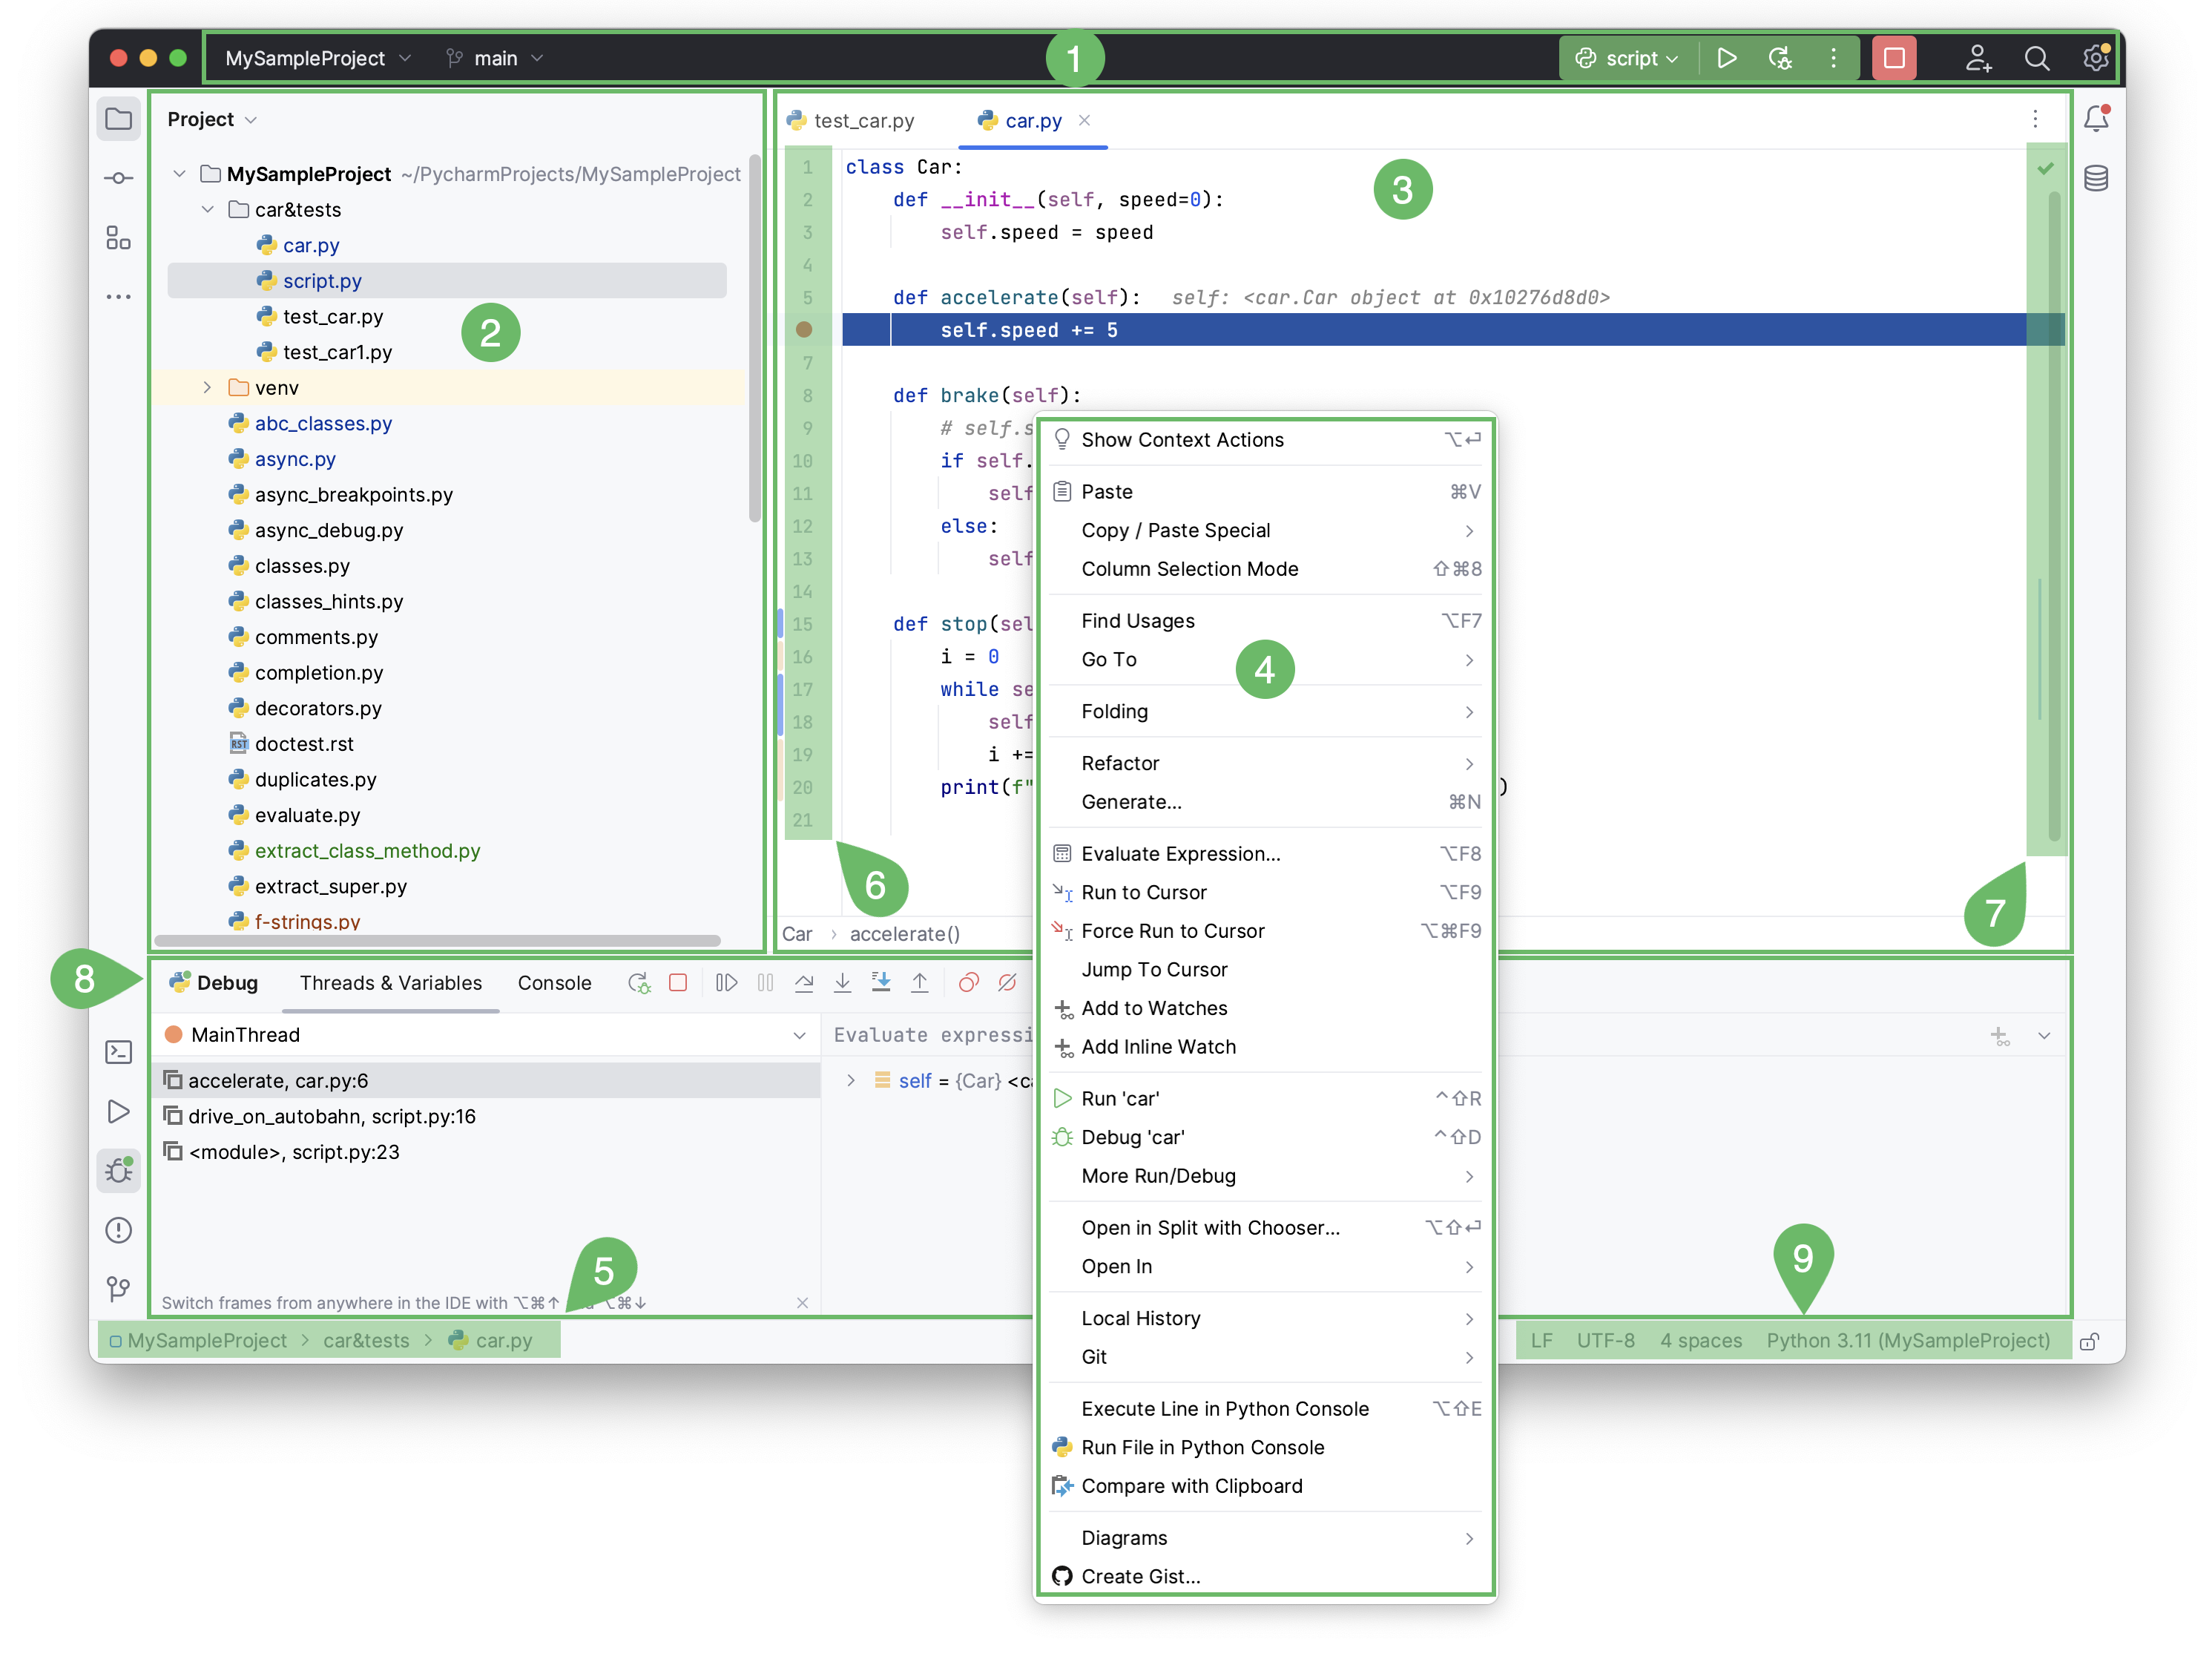
When you open a project in PyCharm, the default user interface looks as follows:

Window header contains a set of widgets which provide quick access to the most popular actions: project widget, VCS widget, and run widget. It also allows you to open Code With Me, Search Everywhere, and Settings.
Project tool window on the left side displays your project files.
Editor on the right side, where you actually write your code. It has tabs for easy navigation between open files.
Context menus open when you right-click an element of the interface or a code fragment and show the actions available.
Navigation bar allows you to quickly navigate the project folders and files.
Gutter, the vertical stripe next to the editor, shows the breakpoints you have, and provides a convenient way to navigate through the code hierarchy like going to definition/declaration. It also shows line numbers and per-line VCS history.
Scrollbar, on the right side of the editor. PyCharm constantly monitors the quality of your code by running code inspections. The indicator in the top right-hand corner shows the overall status of code inspections for the entire file.
Tool windows are specialized windows attached to the bottom and the sides of the workspace. They provide access to typical tasks such as project management, source code search and navigation, integration with version control systems, running, testing, debugging, and so on.
The status bar indicates the status of your project and the entire IDE and shows various warnings and information messages like file encoding, line separator, inspection profile, and so on. It also provides quick access to the Python interpreter settings.

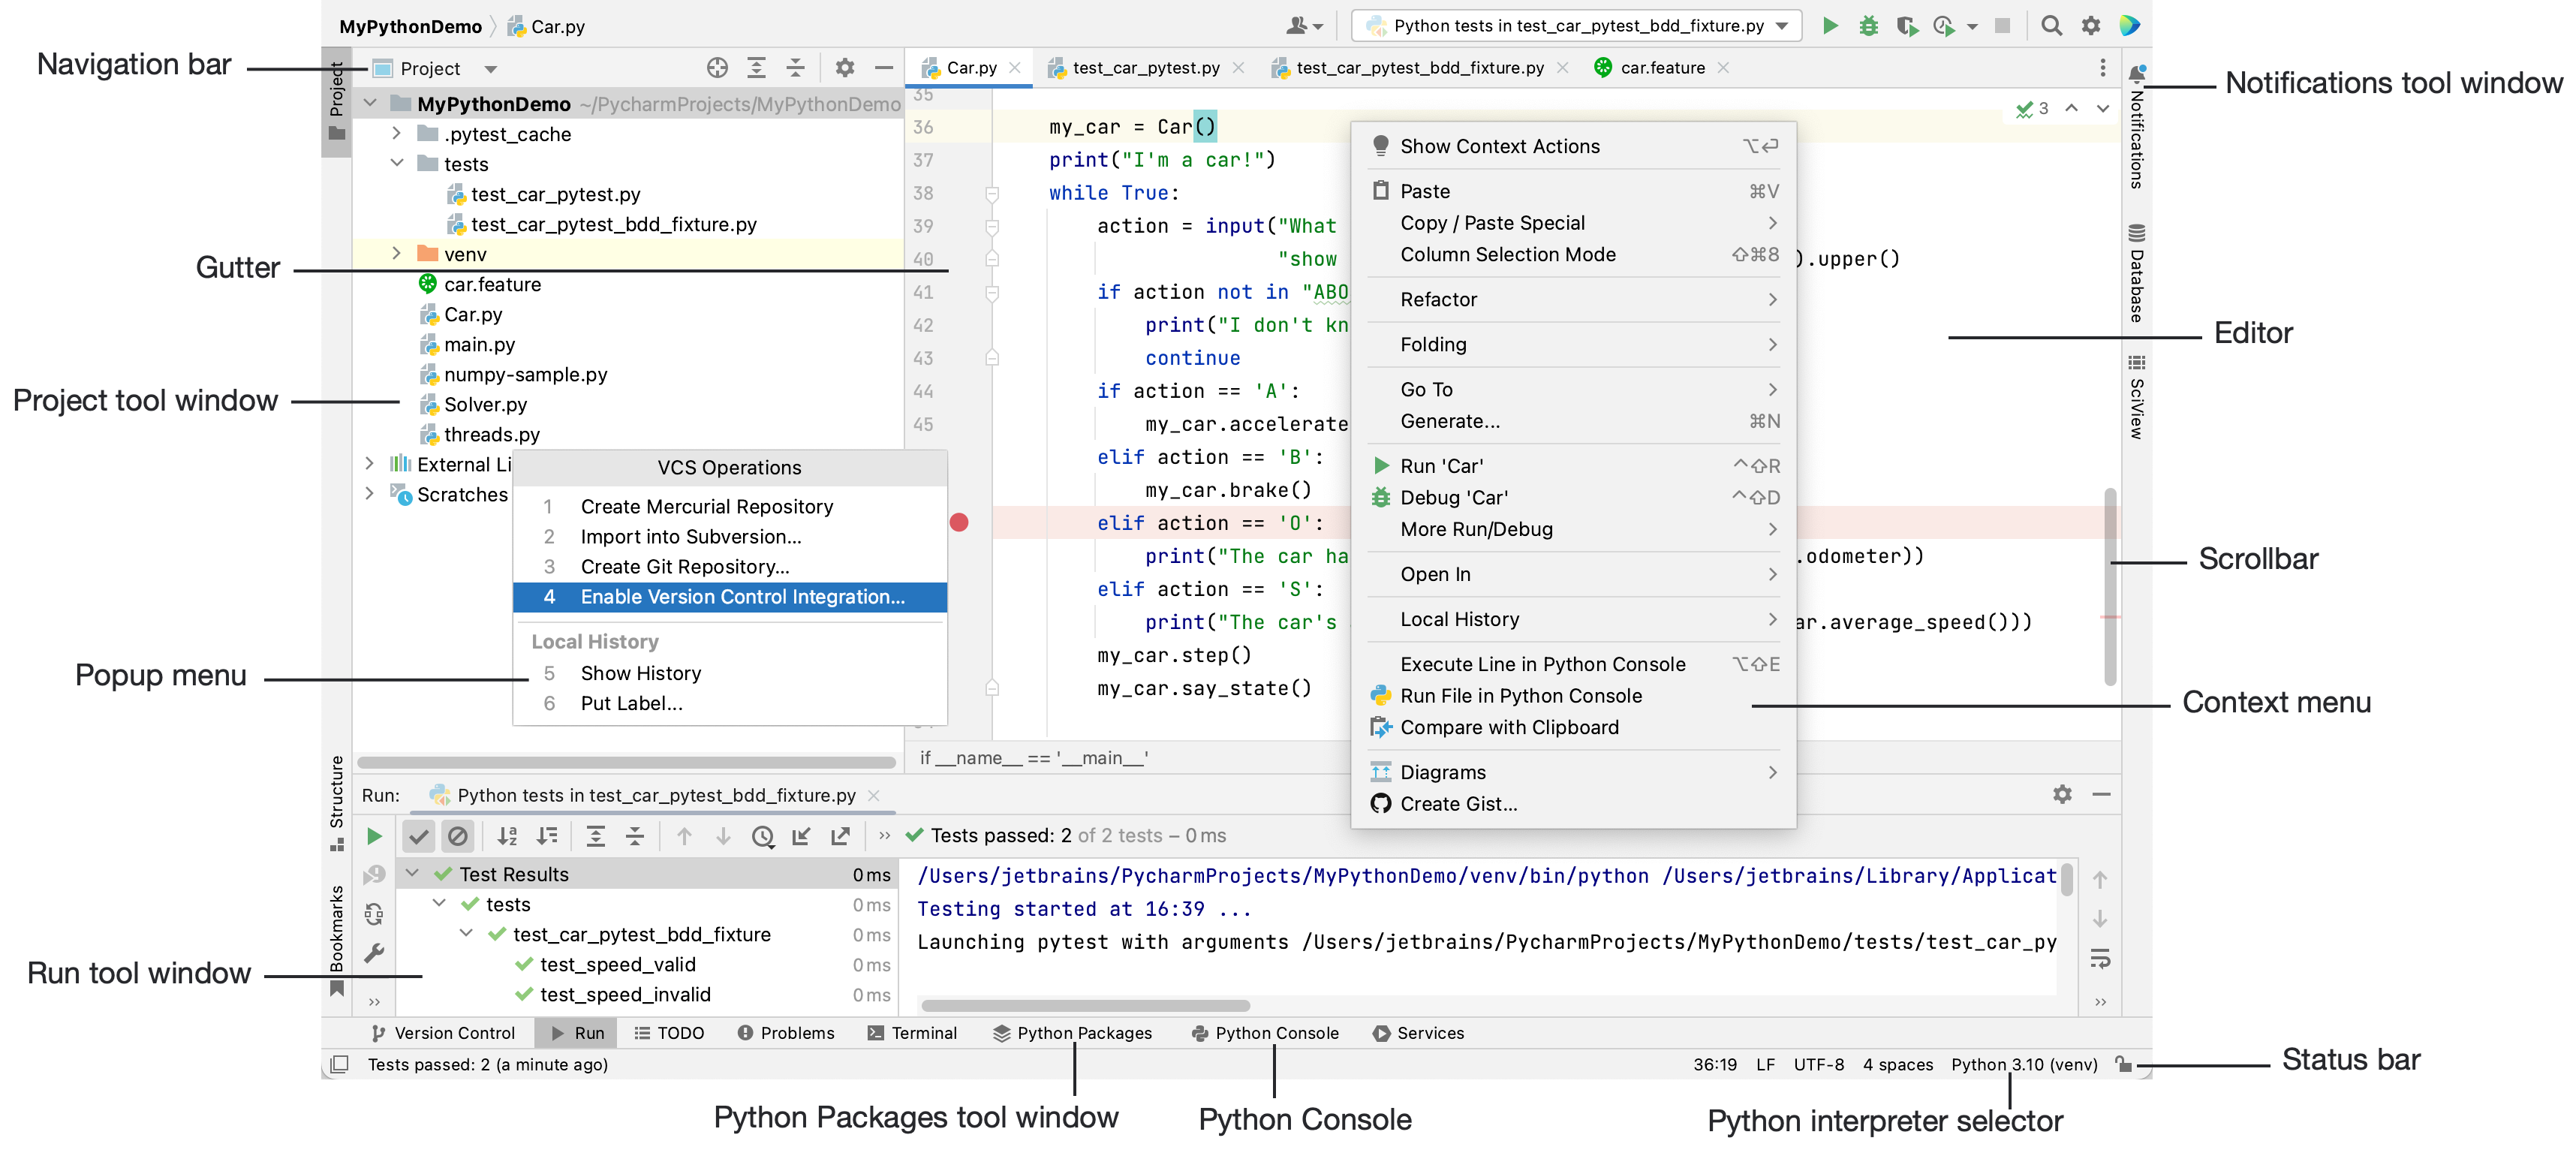
Project tool window on the left side displays your project files.
Editor on the right side, where you actually write your code. It has tabs for easy navigation between open files.
Navigation bar allows you to quickly navigate the project folders and files.
Gutter, the vertical stripe next to the editor, shows the breakpoints you have, and provides a convenient way to navigate through the code hierarchy like going to definition/declaration. It also shows line numbers and per-line VCS history.
Scrollbar, on the right side of the editor. PyCharm constantly monitors the quality of your code by running code inspections. The indicator in the top right-hand corner shows the overall status of code inspections for the entire file.
Tool windows are specialized windows attached to the bottom and the sides of the workspace. They provide access to typical tasks such as project management, source code search and navigation, integration with version control systems, running, testing, debugging, and so on.
The status bar indicates the status of your project and the entire IDE, and shows various warnings and information messages like file encoding, line separator, inspection profile, and so on. It also provides quick access to the Python interpreter settings.
Also, in the bottom-left corner of the PyCharm window, in the Status bar, you see the button or
. This button toggles the showing of the tool window bars. If you hover over this button, the list of the currently available tool windows shows up.
Depending on the set of plugins, PyCharm edition, and configuration settings, your IDE may look and behave differently.
Navigation bar
Focus: Alt+Home
Show/hide:
The navigation bar is a quick alternative to the Project view, where you can go through the structure of your project, open specific files, and jump to specific code elements in the current file.
It is located in the status bar at the bottom of the main window. You can change its location: in the main menu, go to and select Top to display the navigation bar in the top part of the IDE window or Don't show to disable it.
Editor
Focus: Escape
Use the editor to read, write, and explore your source code .
Action indicators and action list
Open the list of available actions: Alt+Enter
Various icons that appear in the gutter, for example, ![]() , help you notice quick-fixes and other actions. Clicking such action indicator or pressing Alt+Enter opens an action list with all other actions that are available at the current caret position.
, help you notice quick-fixes and other actions. Clicking such action indicator or pressing Alt+Enter opens an action list with all other actions that are available at the current caret position.
Status bar
Show/hide:
If you do not use the left part of the status bar as the navigation bar, it shows the most recent event messages. Click a message in the status bar to open it in the Notifications tool window. Right-click the message in the status bar and select Copy to paste the message text when you are searching for a solution to a problem or need to add it to a support ticket or to the PyCharm issue tracker.
The status bar also shows the progress of background tasks. You can click to show the Background Tasks manager.
The right part of the status bar contains widgets that indicate the overall project and IDE status and provide access to various settings. Depending on the set of plugins and configuration settings, the set of widgets can change. Right-click the status bar to select the widgets that you want to show or hide.
The blinking icon in the status bar indicates that an internal IDE error has occurred. Click to view the error descriptions and submit reports.
Widget | Description |
|---|---|
52:11 | Shows the line and column number of the current caret position in the editor. Click the numbers to move the caret to a specific line and column. If you select a code fragment in the editor, PyCharm also shows the number of characters and line breaks in the selected fragment. |
LF | Shows the line endings used to break lines in the current file. Click this widget to change the line separators. |
UTF-8 | Shows the encoding used to view the current file. Click the widget to use another encoding. |
Column | Indicates that the column selection mode is enabled for the current editor tab. You can press Alt+Shift+Insert to toggle it. |
| Click to lock the file from editing (set it to read-only) or unlock it if you want to edit the file. |
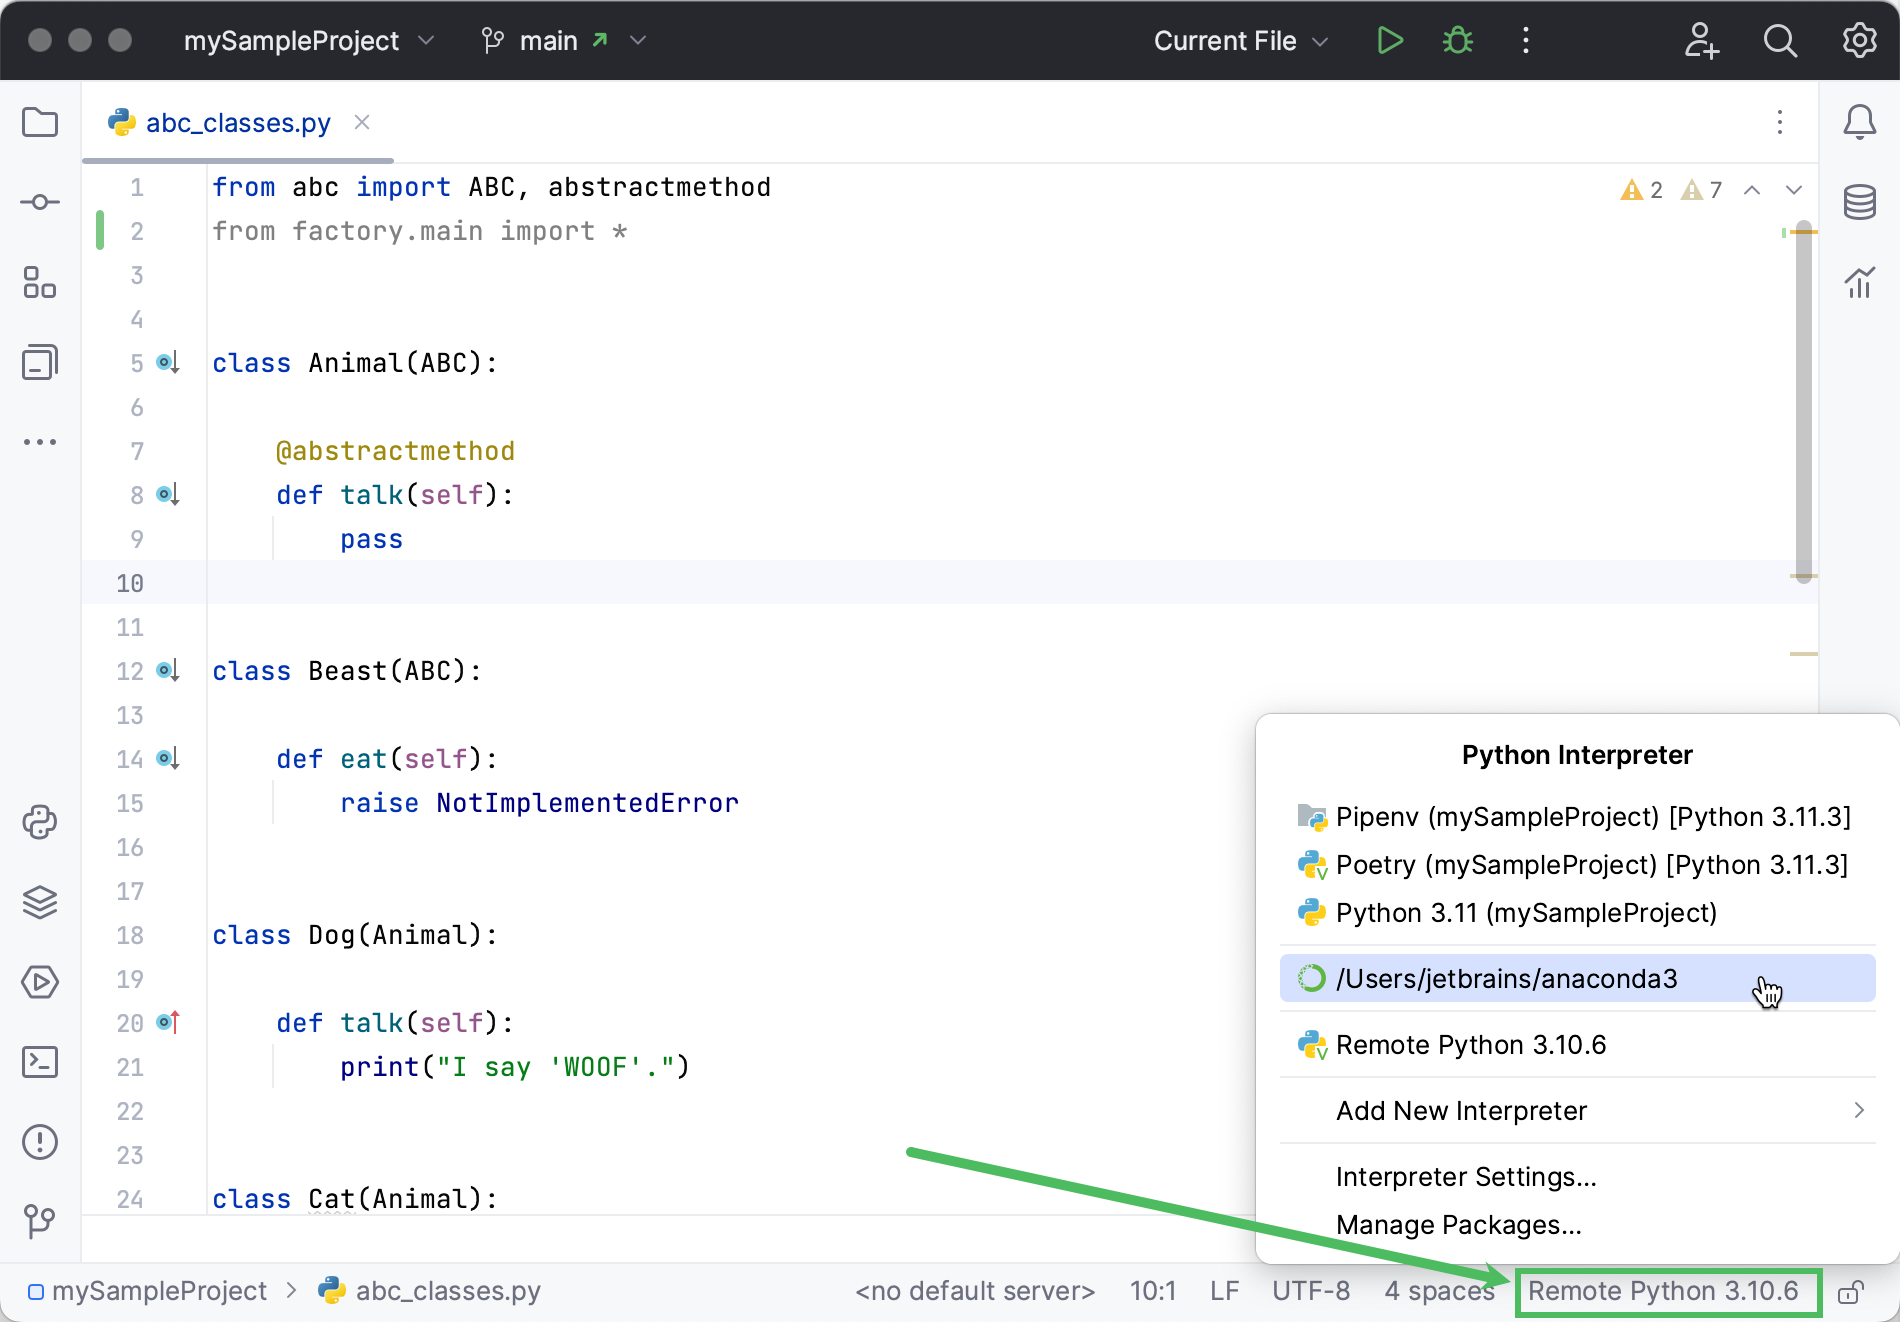
| The Python Interpreter selector. It shows the Python interpreter that currently is in use. Click it to add a new Python interpreter, select an existing interpreter, or open the list of the interpreter settings.  |
| If version control integration is enabled, this widget shows the current VCS branch. Click it to manage VCS branches. |
2 spaces | Shows the indent style used in the current file. Click to configure the tab and indent settings for the current file type or disable indent detection in the current project. |
| Shows the amount of memory that PyCharm consumes out of the total amount of heap memory. For more information, refer to Increase the memory heap of the IDE. |
| Click to set any of the configured deployment servers or server groups as default for performing deployment operations. |
Tool windows
Show/hide:
Tool windows provide functionality that supplements editing code. For example, the Project tool window shows you the structure of your project, and the Run tool window displays the output of your application when you run it.
By default, tool windows are docked to the sides and bottom of the main window. You can arrange them as necessary, undock, resize, hide, and so on. Right-click the title of the tool window or click in the title for its arrangement options.
You can assign shortcuts to quickly access the tool windows that you frequently use. Some of them have shortcuts by default. For example, to open the Project tool window , press Alt+1, and to open the Terminal tool window, press Alt+F12. To jump from the editor to the last active tool window, press F12.
Context menus
You can right-click various elements of the interface to see the actions available in the current context of this element. For example, right-click a file in the Project tool window for actions related to that file, or right-click in the editor to see actions that apply to the current code fragment.
Most of these actions can also be performed from the main menu at the top of the screen or the main window. Actions with shortcuts show the shortcut next to the action name.
Popup menus
Popup menus provide quick access for actions related to the current IDE and project context. Here are some useful popup menus and their shortcuts:
Alt+Insert opens the Generate popup for generating boilerplate code based on the context.
Ctrl+Alt+Shift+T opens the Refactor This popup with a list of contextually available refactorings.
Alt+Insert in the Project tool window opens the New popup for adding new files and directories to your project.
Alt+` opens the VCS Operations popup with contextually available actions for your version control system.
You can create custom popup menus using quick lists of actions that you often use.
Main window
The main window lets you work with a single PyCharm project. You can open multiple projects in multiple windows . By default, the window header displays the name of the project and the name of the currently open file. If there are multiple modules, it will also show the name of the relevant module.
To show the full path to the project and to the current file, select Always show full paths in window header on the Appearance & Behavior | Appearance settings page Ctrl+Alt+S.
See more details on PyCharm UI in the video tutorial: