Browser debugging extensions
To start a debugging session, you need to activate the debugger engine on the server. There are two ways to do this:
Set a special
GET/POSTorCOOKIEparameter manually (for more information, refer to the Xdebug official documentation).Use a browser extension, which lets you enable the debugger with a single click.
The following table provides a non-exhaustive list of the available debugging extensions for Xdebug.
Chrome | Firefox | Internet Explorer | Microsoft Edge |
|---|---|---|---|
Install and use Xdebug Helper for Chrome
Open the Xdebug Helper by JetBrains page on the Chrome Web Store and add the extension to your Chrome browser.
In PhpStorm, enable listening to incoming debug connections by either clicking
on the toolbar or selecting
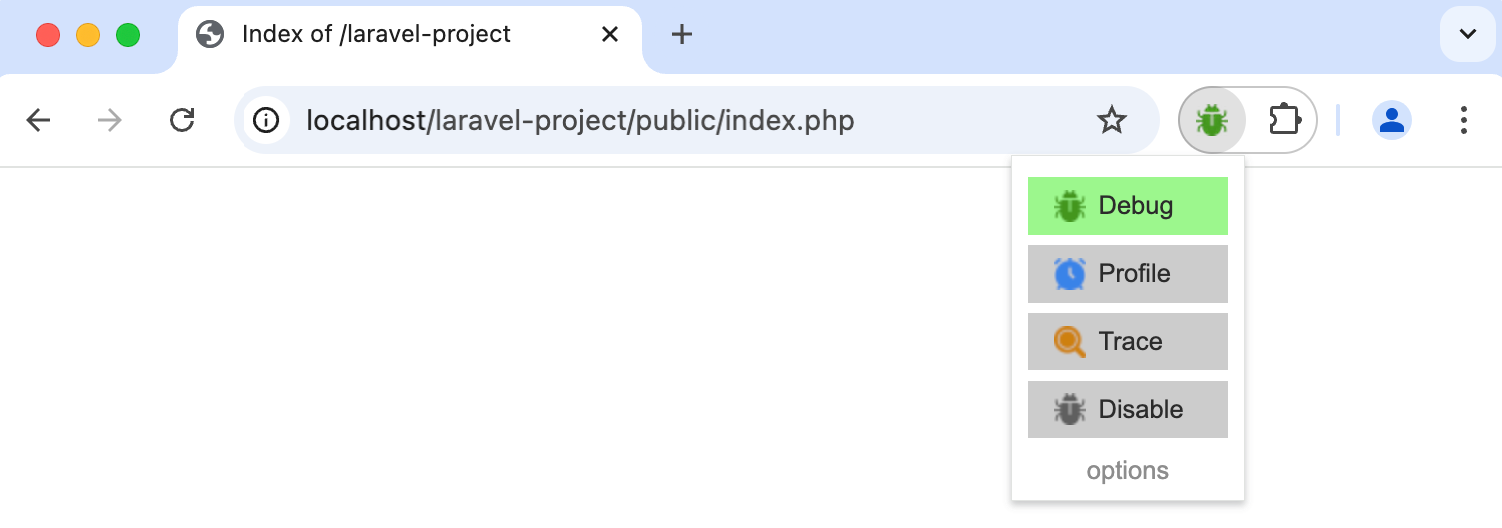
Initiate connection from the browser side. Click the extension icon on the browser toolbar to initiate a debugging, profiling or tracing session:

As a rule, no further configuration is required. You can explore additional settings by right-clicking the extension icon and choosing Options from the context menu.