Code reference information
Definitions
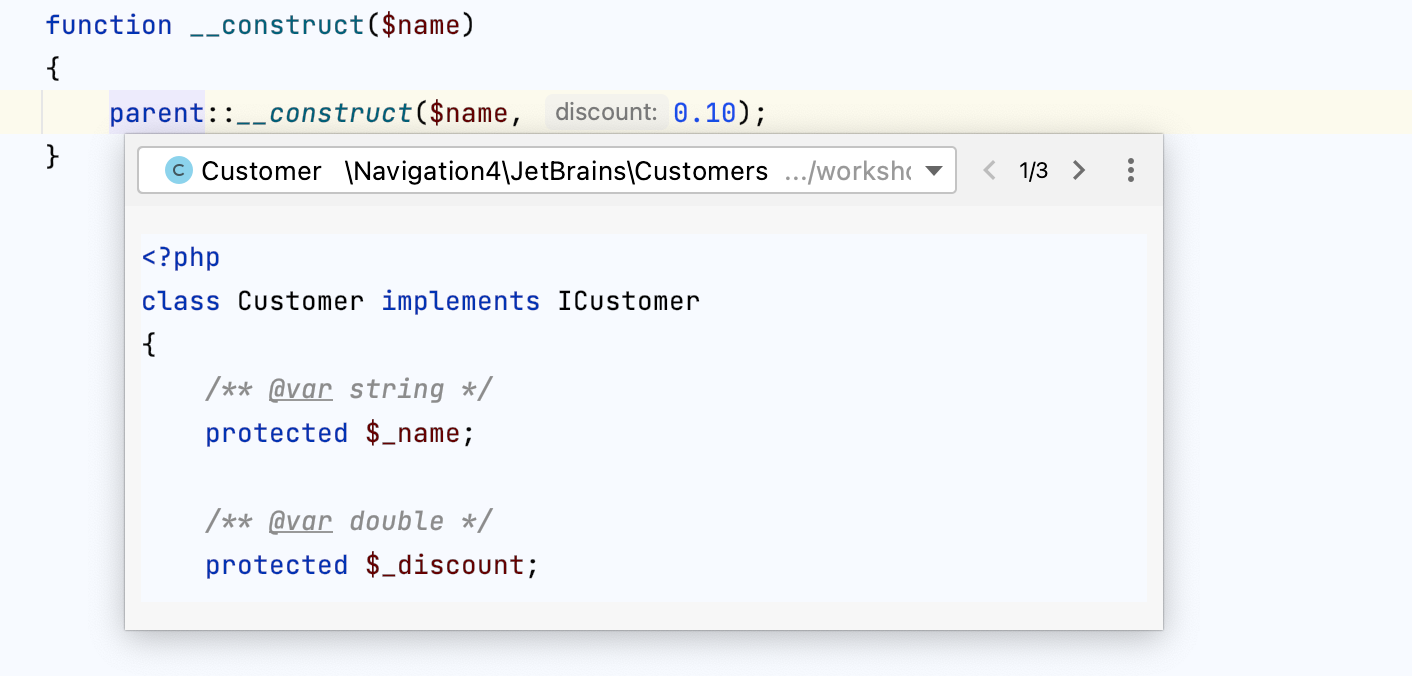
In PhpStorm, you can see where and how symbols, such as tags, classes, fields, methods, or functions are defined in your project. For this purpose, the IDE features the Quick Definition popup.
To view definition of a symbol, select it in the editor and press Ctrl+Shift+I (or click ).

Alternatively, with the Ctrl key pressed, hover the cursor over any symbol. PhpStorm displays the symbol as a link and shows its definition in a tooltip. Click this link to jump to the definition of the symbol.

You can open a definition in the Find tool window. To do so, click the icon in the top-right corner of the popup and click
Open in Find Tool Window.
To open the source code of the definition for editing and close the popup, click the icon and then click
Edit Source (F4).
Type definitions
The Quick Type Definition feature allows you to view the type definition of variables, properties, methods, or any other symbols in a popup without switching from the code you're editing.
Place the caret at the symbol for which you want to view the type definition and select .

To open the source code of the definition for editing and close the popup, click the
icon and then click
Edit Source (F4).
PhpStorm doesn't have a default keyboard shortcut for this action, but you can manually configure it in the settings. For more information on how to configure custom shortcuts, refer to Configure keyboard shortcuts.
Parameter info
The Parameter Info popup shows the names of parameters in method and function calls. PhpStorm automatically shows a popup with all available method signatures within 1 second (1000 milliseconds) after you type an opening bracket in the editor, or select a method from the suggestions list.
You can explicitly invoke the popup if it has closed or if your IDE is configured not to show the popup automatically. To do so, press Ctrl+P (or click ).

Show full method or function signatures
By default, the parameter info popup shows simple signatures. You can configure the IDE to show full signatures that include method names and returned types.
In the Settings/Preferences dialog (Ctrl+Alt+S), go to , and select the Show full method signatures checkbox.

Make sure to include the required third-party JavaScript libraries and PHP-related items in the project source path. Otherwise, the names of parameters will not be displayed.
Configure the parameter info popup
In the Settings/Preferences dialog (Ctrl+Alt+S), go to .
In the Show the parameter info popup in ... milliseconds field, specify the time in milliseconds after which the popup should appear.
If you don't want the popup to appear automatically, clear the Show the parameter info popup in ... milliseconds checkbox.
Inlay hints
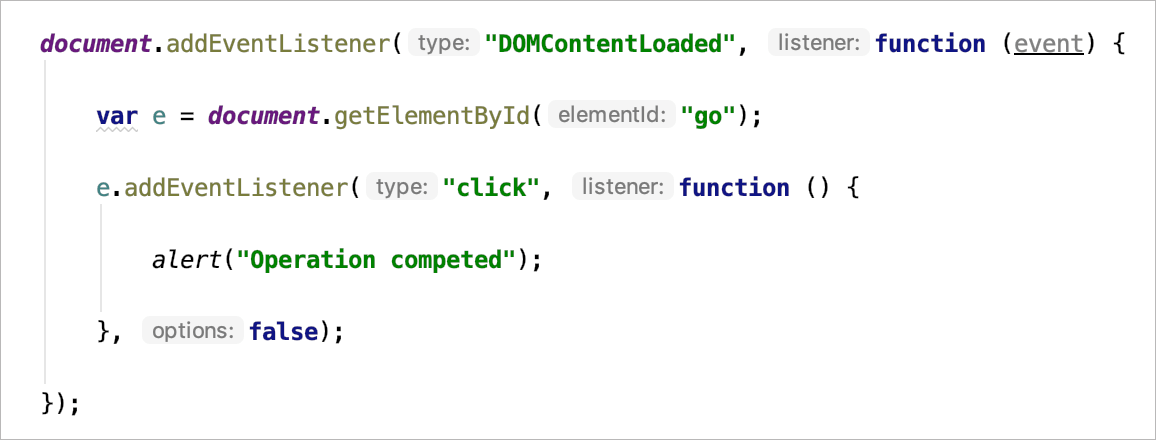
Inlay hints are special markers that appear in the editor and provide you with additional information about your code, like the names of the parameters that a called method expects. Other types of hints inform you about annotations, method parameters, usages, and so on (depending on the language).


Some of the hints are enabled by default.
You can fine-tune inlay hints in . For detailed explanation of what each type does, see Inlay Hints.
In the PHP context, you can choose the following options:
Show name for all arguments: if selected, parameter name hints are displayed for all arguments. Otherwise, parameter hints are displayed only for literals or
nullvalues but not for named objects.
Always show pass by reference: if selected, the
¶meter hints are shown for arguments that are passed by reference. The names of the arguments that match the parameters' names are omitted if the Show name for all arguments checkbox is cleared.
Configure the parameter hints exception list
If you don't want to see parameter hints for specific methods, you can configure the list with exceptions. By default, the exception list contains a number of pre-defined methods. You can remove a method from the list to see the hints for it, or add new methods to hide their hints in the editor.
In the Settings/Preferences dialog (Ctrl+Alt+S), select and click the necessary language.
Select Parameter hints in the list in the middle section.
The options for configuring hints become available on the right.
Add methods for which you don't want to see the hints to the Exclude list section.
Add cases for which you do not want to see the hints to the Exclude list section. To add a case, click the inline hint in your code, press Alt+Enter and select Do not show hints for current method.
Apply the changes and close the dialog.
Quick Documentation
You can get quick information for any symbol right from the editor by means of the Quick Documentation feature. It shows you code documentation in a popup as you hover the mouse over code elements.
For markup languages, PhpStorm retrieves reference from the language specification according to the Document Type setting.
For information on retrieving inline documentation in the JavaScript or PHP context, refer to JavaScript documentation look-up and PHPDoc Comments respectively.
Documentation look-up is also available for Drupal hooks, see Drupal.
Quick Documentation in a popup
View Quick Documentation in a popup
Hover the mouse over the necessary symbol in the editor.
Place the caret at the symbol and press Ctrl+Q ().
Press Ctrl+Q again to open this documentation in the Documentation tool window.

Click in the popup to change the font size, display the quick documentation toolbar, or go to the source code.
Disable Quick Documentation on hover
By default, the quick documentation popup appears as you hover the mouse over code elements. You can configure the IDE to display the popup only after you explicitly invoke the Quick Documentation feature.
Click
in the popup and disable the Show on Mouse Move option.
In the Settings/Preferences dialog (Ctrl+Alt+S), go to and clear the Show quick documentation on hover checkbox.
In this case, to view documentation for a symbol at caret, press Ctrl+Q or select from the main menu. The documentation will be shown in a popup, but you can configure the IDE to display it in the tool window right away.
Quick Documentation in the tool window
View documentation in the tool window
With the default settings, pressing Ctrl+Q () opens quick documentation opens a popup. You can change the settings to view documentation in the tool window.
In the quick documentation popup, click
and disable the Show Documentation Popup First option.
In the Documentation tool window, click the
icon on the tool window toolbar and disable the Show Documentation Popup First option.
Keep documentation in the tool window
You can open a piece of documentation for a specific code element in the tool window and keep viewing documentation for other elements in your current file.
Place the caret at the required code element and press Ctrl+Q. If the popup appears, press Ctrl+Q again to switch to the tool window.
The asterisk symbol (
*) on the documentation tab means that the tab is not pinned, so its content will be replaced by documentation for another code element that you select in the editor.Right-click the tab with the documentation in the documentation tool window and enable the Keep This Documentation option.
After that, the current documentation tab will be pinned. You can return to the editor and view documentation for other code elements that will open either in the popup or in a new tab in the tool window.

When you are viewing code documentation in the tool window, it is displayed on the unpinned tab (the tab marked with the asterisk symbol (*). There are several ways in which you can work with it:
You can view documentation by hovering the mouse over code elements.
Click the icon on the tool window toolbar and enable the Show on Mouse Move and Auto-Update from Source options.
You can view documentation as you place the caret at symbols in the editor either by clicking them or by moving the caret.
Click the icon on the toolbar, disable the Show on Mouse Move and enable the Auto-Update from Source options.
You can view documentation by placing the caret at a symbol and pressing Ctrl+Q or selecting from the main menu.
Click the icon on the tool window toolbar, disable the Show on Mouse Move and Auto-Update from Source options.
External documentation
External documentation opens the necessary information in a web browser so that you can navigate to related symbols and keep the information for further reference at the same time.
View external documentation
To view documentation for a symbol at the caret in a browser, press Shift+F1 or select from the main menu.
Type Info
In PhpStorm, you can identify the type of a variable or expression in the following way:
Place the caret at the necessary code element and press Ctrl+Shift+P (or select from the main menu).
If several expressions are available, select the desired one from the popup menu and press Enter.

Productivity tips
- Copy tooltip text to the clipboard
To copy tooltip text to the clipboard, hold Alt (on Linux, hold Ctrl+Alt) and click the tooltip.
- View context information
If the current method or class declaration is not visible, you can view it in the tooltip by pressing Alt+Q.