File structure
IntelliJ IDEA allows you to view and navigate the structure of a file in the Structure tool window and the Structure popup.


You can see the VCS status colors in the Structure tool window and the Structure popup if your project is under version control. It helps you track changes in files. The names of modified objects become blue, and the names of the newly added objects appear highlighted in green.
Hover over icons in Structure to get additional information in tooltips about the items. For example, you can learn whether methods are static.
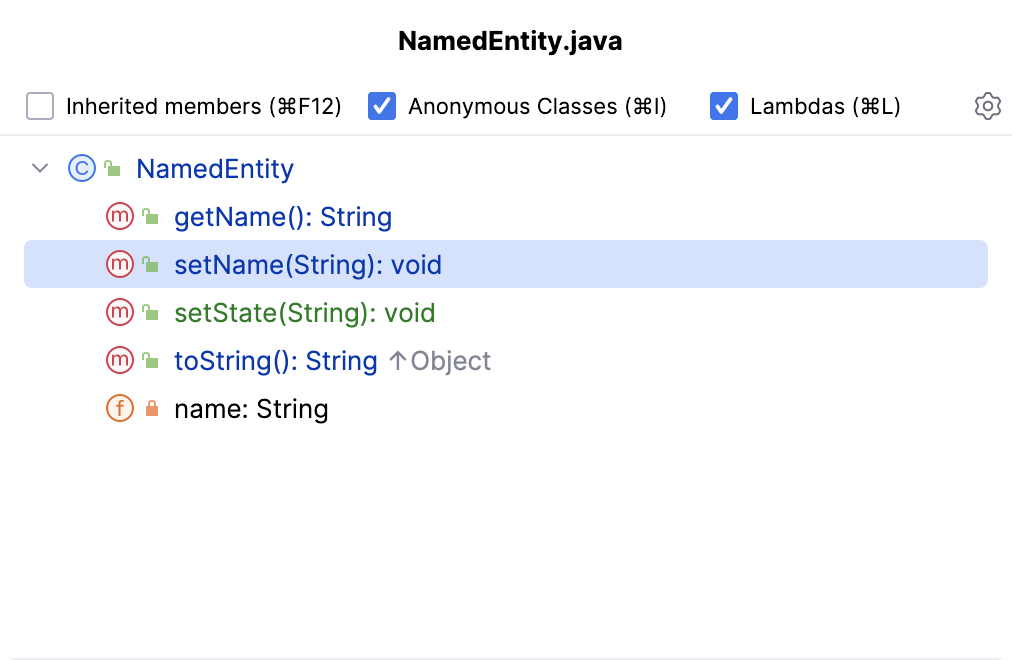
Structure popup
The popup provides less information than the tool window, but it allows you to navigate the structure faster due to the Narrow down on typing option.
Open a file in the editor and press Ctrl+F12, or go to in the main menu.
In the popup, start typing the name of the element that you want to find. The IDE will narrow down the search results as you type.
You can also use CamelHumps, that is, for example, you can type
dsuto matchDoSomethingUseful.You can additionally narrow down your search results by using the checkboxes in the popup. To change the sorting, click
and select the necessary option.
Press Enter or click an item to close the popup and navigate to the selected element in the editor.

- Inherited members
Displays all methods and fields inherited by the current class and accessible from it. The inherited members are displayed gray to distinguish them from the members defined in the current class.
- Anonymous Classes
Displays inner anonymous classes in the tree view.
- Lambdas
Displays all lambdas in the tree.
- Alphabetically
Sorts elements within a class alphabetically.
- By Visibility
Sorts items by their visibility in the following order: public - protected - package local - private.
- Narrow down on typing
Hides irrelevant items as you type. When this option is disabled, the IDE highlights all items that match your search query without hiding irrelevant items.
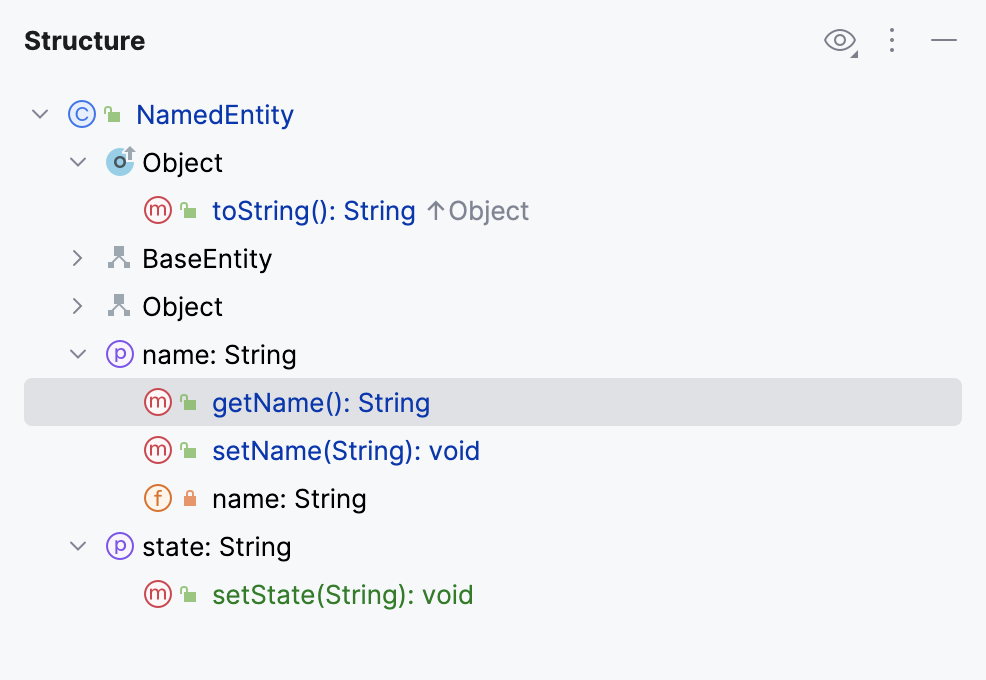
Structure tool window
Open a file in the editor or select it in the Project tool window.
Press Alt+7 or go to in the main menu.
In the tool window, start typing the name of the element that you want to find. You can also use CamelHumps. The IDE will highlight the search results as you type.
You can additionally narrow down your search results or sort the items in the tool window by using the options located under
.

View options
Sort
- Alphabetically
Sorts elements within a class alphabetically.
- By Visibility
Sorts the items by their visibility in the following order: public - protected - package local - private.
Show
- Anonymous Classes
Displays inner anonymous classes in the tree view.
- Fields
Displays all fields (properties) in the tree.
- Inherited
Displays all methods and fields inherited by the current class and accessible from it. The inherited members are displayed gray to distinguish them from the members defined in the current class.
- Lambdas
Displays all lambdas in the tree.
- Non-public
Displays all non-public class members.
Turn the option off to hide all non-public members.
- HTML Outline
(Only for HTML files) Displays HTML 5 outline of an HTML file
- DDL statements
(Only for SQL files) Displays only DDL statements (for example,
CREATE,ALTER,DROP, and other statements).- DML statements
(Only for SQL files) Displays only DML statements (for example,
SELECT,INSERT,UPDATE,DELETE, and other statements).- Select statements
(Only for SQL files) Displays only
SELECTstatements.- Other
(Only for SQL files) Displays only statements that do not fall under the previous categories.
Group
- Methods by Defining Type
Groups all methods that override or implement the methods of a particular class or interface under the node that corresponds to this class or interface.
- Properties
Displays getters, setters, and fields in the tree.
- Group by type
(Only for SQL files) Group statements by their type (for example, DDL statements, DML statements,
SELECTstatements, and Other).
Run code from the Structure tool window
The Structure tool window allows you to run and debug your code.
Right-click a runnable method in the Structure tool window and select
Run 'method name' (Ctrl+Shift+F10) or
Debug 'method name' (⌃ ⇧ D).
Run tests from Structure
In the Structure tool window, you can select one or several test methods in a class to run. In this case, the IDE also creates a temporary run configuration with these methods that you can save and edit.
In the Structure tool window, right-click one or several test methods and select
Run 'method name' (Ctrl+Shift+F10).

The tool window allows you to add test methods to an existing run configuration (for JUnit and TestNG tests) in which the test scope is specified by means of a pattern. You can add methods from several different classes creating a test suite.
Right-click a method in the Structure tool window and select:
Add to temp suite: <Configuration_name> if there is only one configuration with the Pattern test scope.
Add to JUnit Pattern Suite (JUnit) / Add to Temp Suite (TestNG) if there are several configurations with the Pattern test scope. In this case, a popup appears in which you can select the target configuration.

Group members
In , you can group class members in Structure by annotating them in your source code.
In the editor, select a code fragment and press Ctrl+Alt+T or go to in the main menu. Select the necessary folding region comment,
regionoreditor-fold.IntelliJ IDEA inserts the comments around the selected code. Learn more from Surround code fragments.
The Structure tool window and Structure popup mark these regions with
.

Show members in the Project tool window
In the Project tool window Alt+1, click
in the header and select .
