Analyze the memory snapshot
This topic explains how to analyze the snapshot after you have taken it in IntelliJ IDEA or opened an external one.
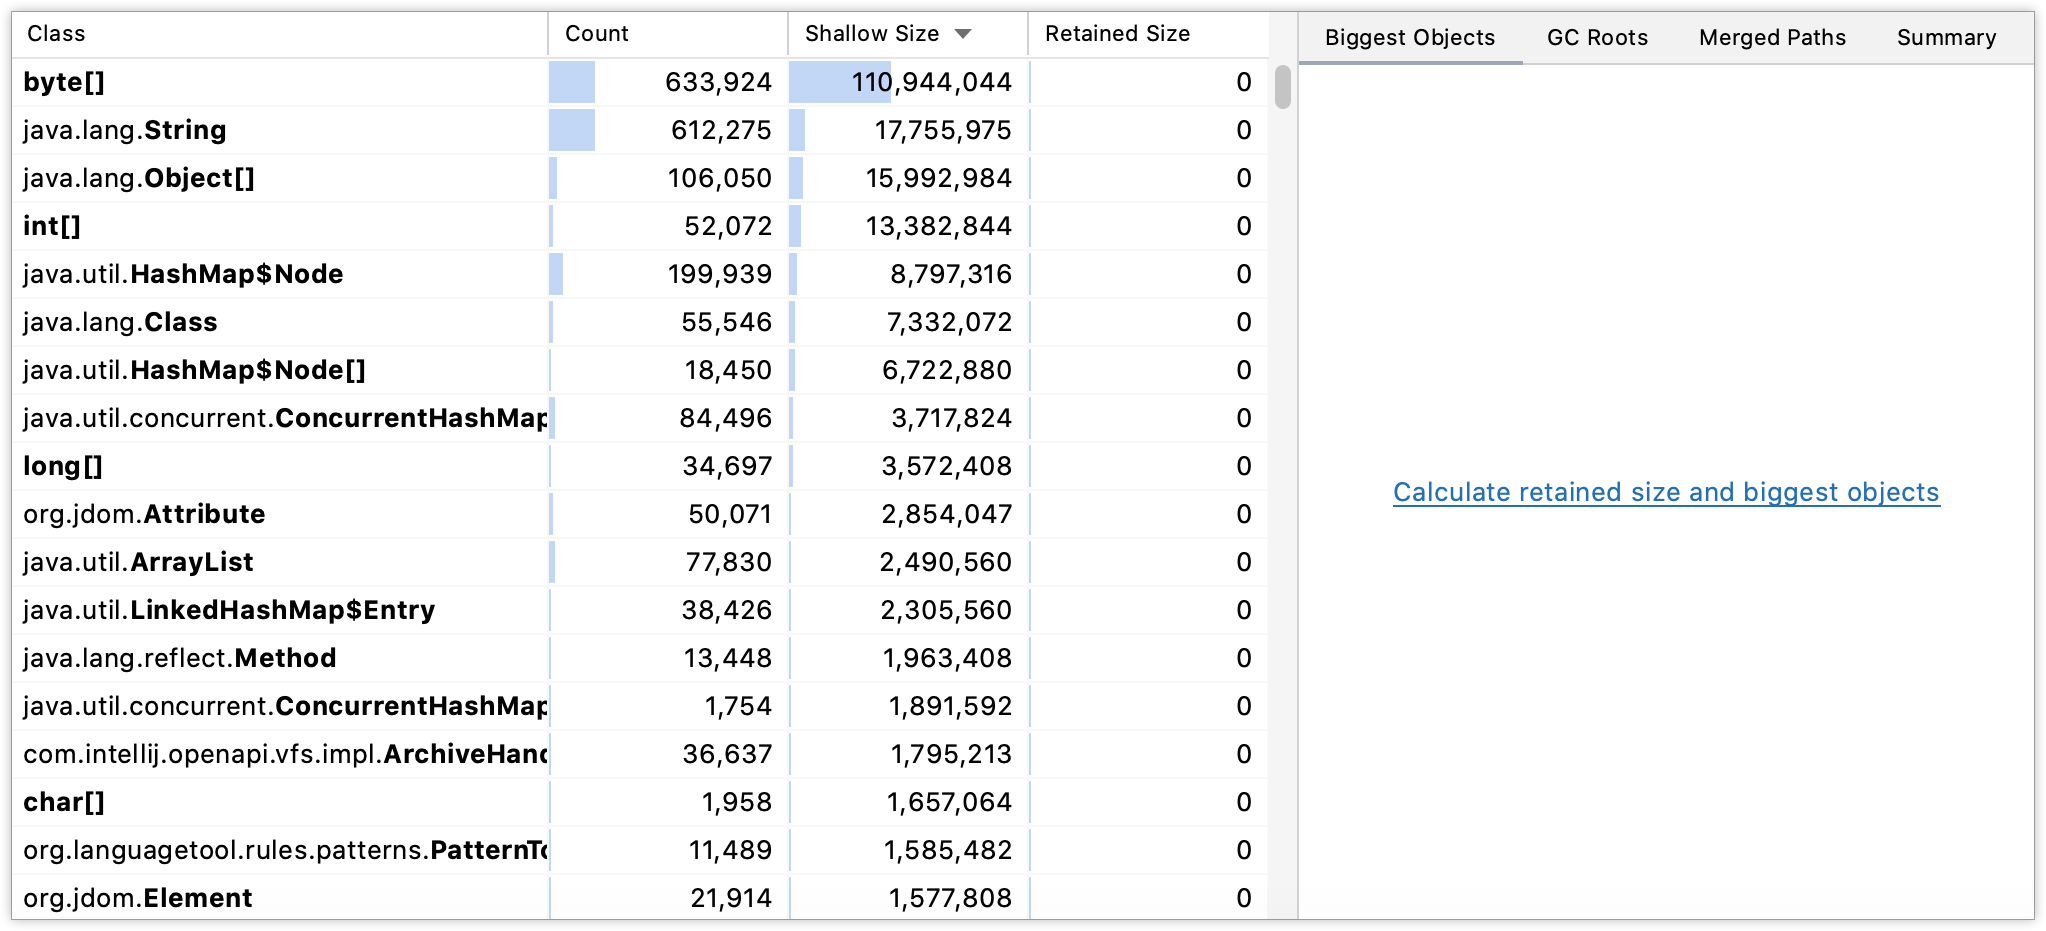
IntelliJ IDEA opens the Profiler tool window with a memory snapshot breakdown.

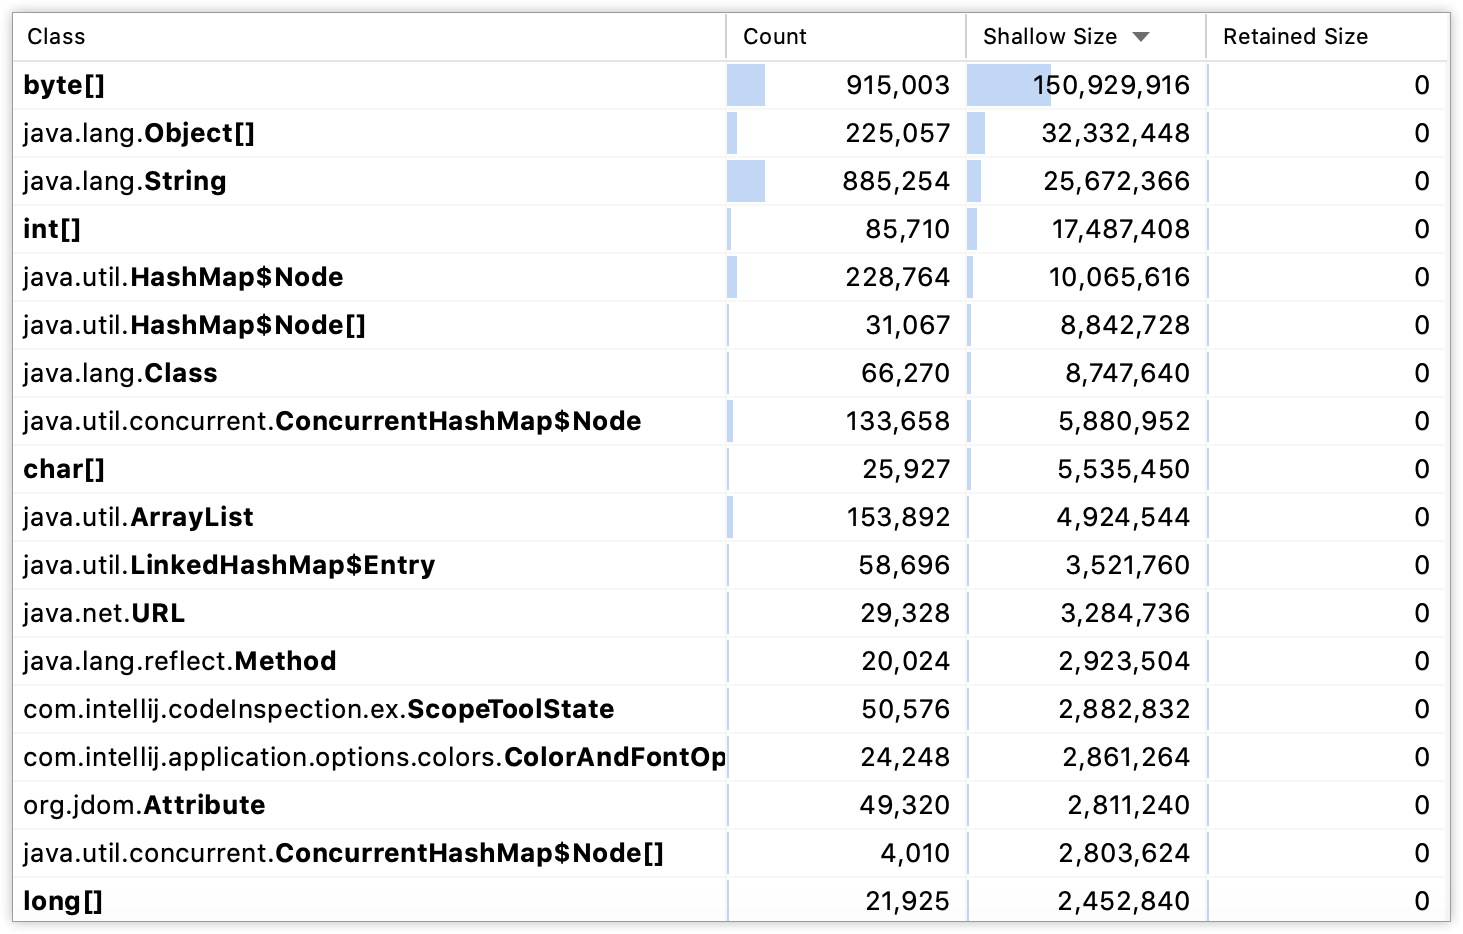
The left-hand part of the snapshot displays the list of classes in your application, how many live instances each class has, the shallow size and retained size of all instances.
Shallow size: the amount memory allocated to store the object itself. It does not include the sizes of the objects that are referenced by this object.
Retained size: the sum of the object's shallow size and the shallow sizes of its retained objects (objects are only referenced from this object). In other words, the retained size is the amount of memory that can be reclaimed by garbage-collecting this object.

The right-hand part of the snapshot has several tabs that allow you to calculate and display the following information:
The Biggest Objects tab lists objects that retain most of the memory ordered by their retained size. These objects are presented as dominator tree roots. This tab can help you find memory leaks caused by individual objects.

The GC Roots tab shows the list of classes with their corresponding garbage collector root objects. This information is an overview of all objects that could not be garbage collected the moment the snapshot was taken. It may be useful, for example, to see which classloader accounts for most memory consumption in an app server.

The Merged Paths tab shows groups objects by class and shows the path to the dominator objects that retain them. This information helps understand why instances of a particular class are retained.

The Summary tab shows general information, for example, the total size, number of instances and stack traces of the threads.

The Packages tab shows the breakdown for all objects by package. This helps you quickly identify which subsystem accounts for most memory consumption and possible memory leaks.

Object view
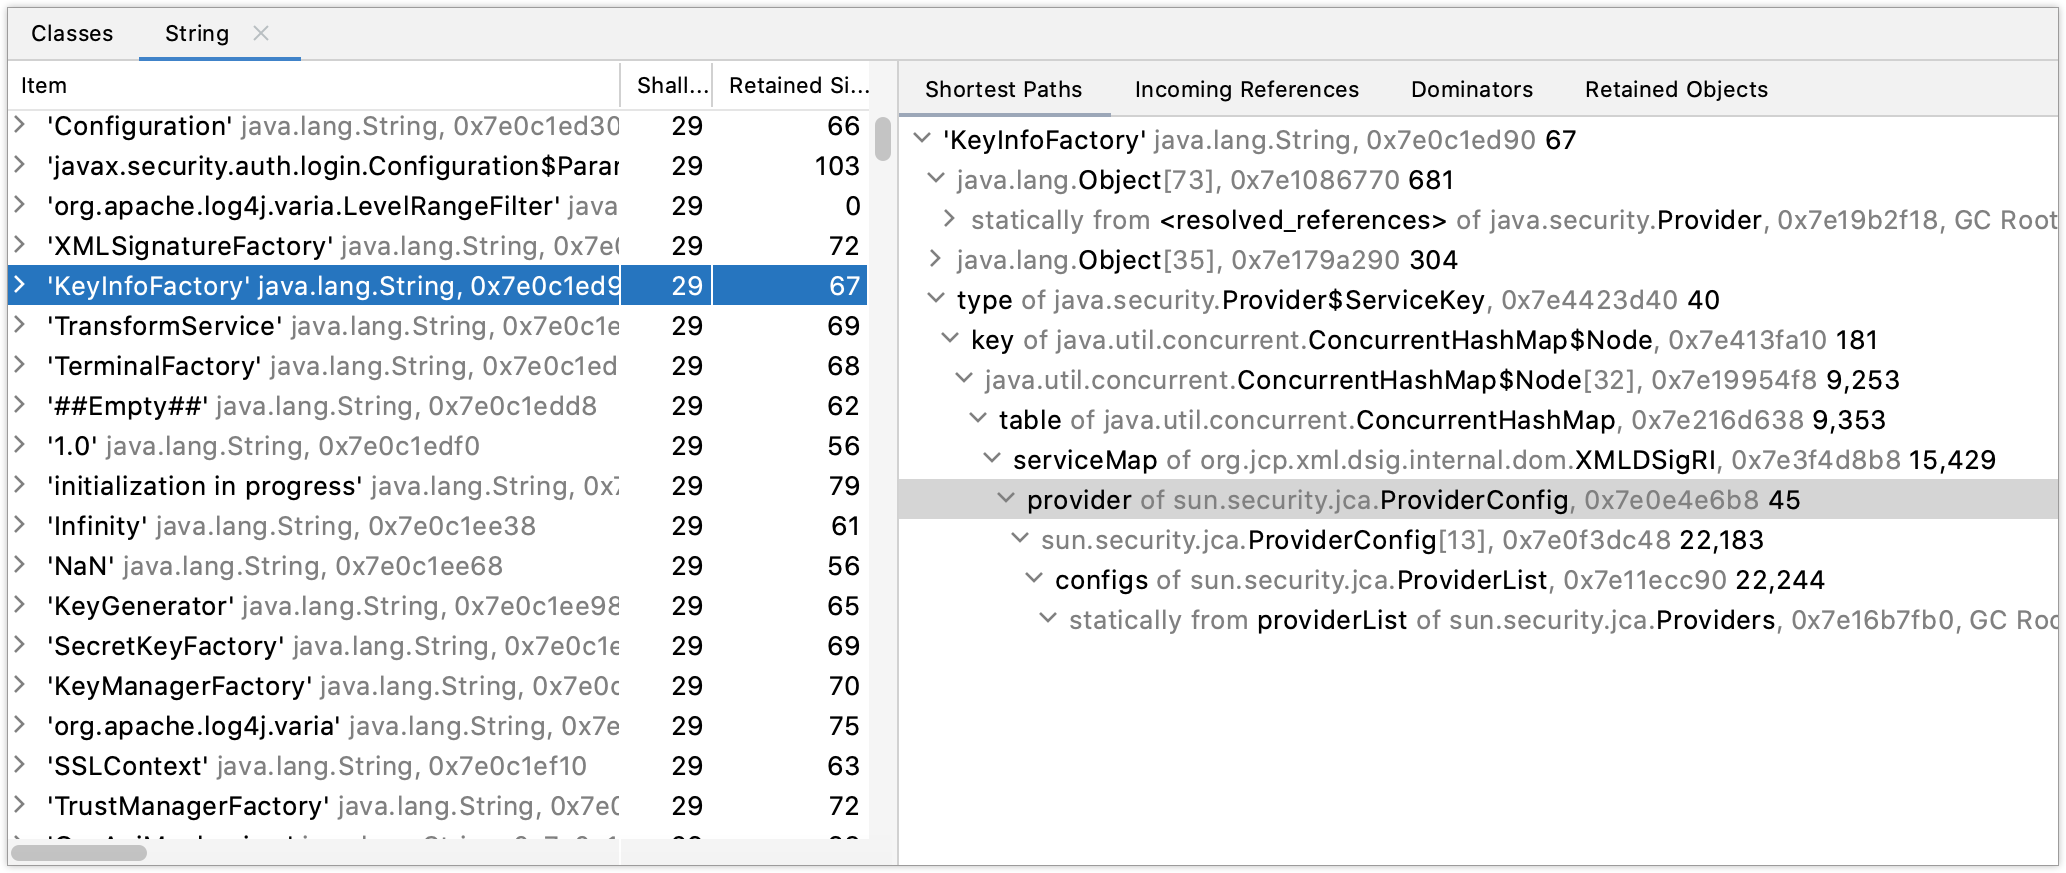
The Object view displays class instances ordered by their retained size.
You can open the view by double-clicking an item on the Classes tab. You can also right-click an item and select Open in New Tab or press Enter.

For each class instance, there are several tabs that allow you to calculate and display the following information:
Shortest Paths: the shortest reference chains to garbage collector roots.
Incoming References: incoming references from other instances.
Dominators: allows you to see what objects retain particular instances (prevent them from being garbage collected). Every instance has only one dominator or hasn't got any.
Retained Objects: a sunburst diagram showing how retained objects contribute to the retained size of a particular object.
Dominator Tree: the tree of retained objects. It allows you to see how much memory can be reclaimed by removing a reference to a specific object and which particular objects will be garbage-collected together with it.
Productivity tips
- Use speed search
On the Classes tab and in the Object view, you can use speed search.
Start typing a class name. As you type, the Search for field appears over the tool window showing the entered characters, and the selection moves to the first item that matches the specified name. For more information, refer to Speed Search in tool windows.
- Navigate to source
You can quickly navigate from the Profiler tool window to the corresponding line in the source code: right-click an item and select Jump to Source or press F4.