File and project analysis
IntelliJ IDEA analyzes your code in the file that is currently opened in the editor and highlights detected problems as you type. It also automatically checks your entire project for errors.
Additionally, you can run an inspection or a group of inspections in the selected scope of files manually. In this case, you will get a comprehensive report of all detected problems.
Current file
The IDE continuously checks your code and searches for problems. The widget in the top-right corner of the editor displays the number of problems of each severity detected in the current file:
![]()
Click the widget to open the list of problems in the File tab of the Problems tool window. You can also access the Problems tool window by selecting or by pressing Alt+6.
For each problem, you can see the suggested quick-fix by pressing Alt+Enter or by clicking . You can also jump to the corresponding line in the editor by pressing F4 or by double-clicking the problem in the tool window.
Alternatively, click to be able to view and fix problems in the tool window.
The color stripe in the scrollbar also marks the detected code problems and helps you quickly access the corresponding lines without scrolling the file. Hover over a mark on the stripe to see the detected problem in a tooltip. Click a mark to jump to the corresponding line.
Navigate to detected problems
You can jump from one highlighted problem to another within a file by clicking
in the widget or by pressing F2 or Shift+F2 accordingly. By default, the IDE will navigate you to problems according to their severity: errors > warnings > weak warnings > server problems > typos.
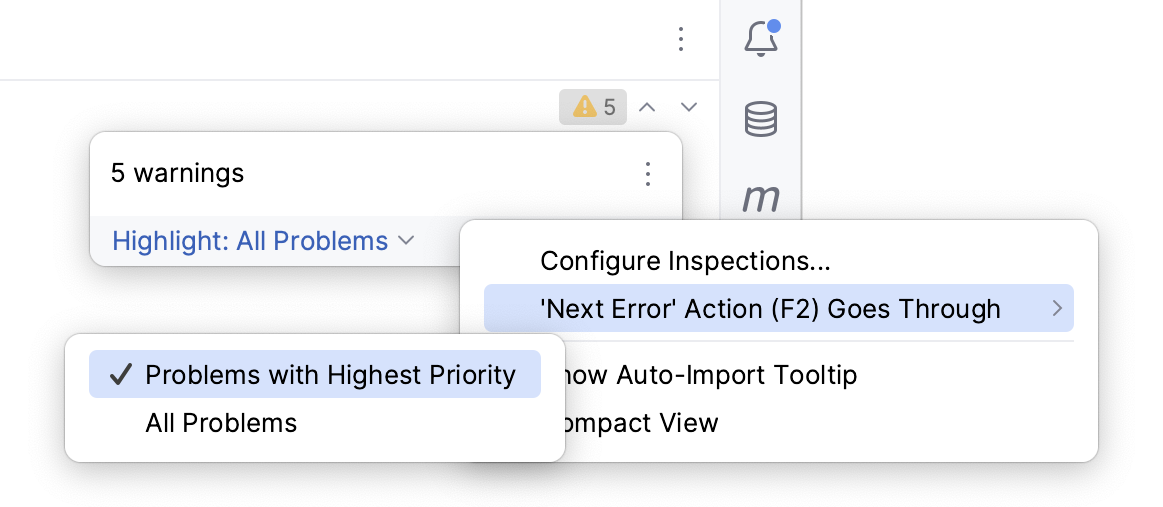
You can configure IntelliJ IDEA to take you through the problems one by one regardless of their severity. Hover over the widget in top-right corner of the editor, click , select 'Next Error' Action (F2) Goes Through, and enable All Problems.

Project errors (Java only)
Apart from viewing all problems in a single file, you can take a look at all problems detected across your entire project by using the project-wide analysis.
Currently, the project-wide analysis works only in Java projects. It might work incorrectly in projects that combine Java with other languages, such as Kotlin or Scala.
Enable project-wide analysis
By default, the analysis is disabled. To enable it:
Open the Problems tool window by selecting from the main menu or by pressing Alt+6.
Switch to the Project Errors tab and click the
icon on the left toolbar.

The first time you run the analysis, it will take longer than normal. Once the analysis is finished, you will see a list of all problems detected in the project.
For each problem, you can see the suggested quick-fix by pressing Alt+Enter or by clicking . You can also jump to the corresponding line in the editor by pressing F4 or by double-clicking the problem in the tool window.
Alternatively, click to be able to view and fix problems in the tool window.
To disable the project-wide analysis, click on the left toolbar of the Problems tool window.
When the project-wide analysis is disabled, the Project Errors tab of the Problems tool window displays the results of the latest build.
Configure the project-wide analysis
Press Ctrl+Alt+S to open the IDE settings and then select .
Configure the following options:
Thread count used by Project-Wide analysis: IntelliJ IDEA automatically sets the number of threads that are used for the analysis. If you want to set the number yourself, specify the required value. After that, restart the IDE.
Analysis delay after change: wait for the specified amount of time to trigger the analysis after you make changes in code.