Debug Python code
Preparing an example
Do you remember the quadratic formula from math class? This formula is also known as the A, B, C formula, it’s used for solving a simple quadratic equation: ax2 + bx + c = 0. As manually solving quadratic formulas gets boring quickly, let’s replace it with a script.
Copy the following code into a file in your project (though it is recommended to type this code manually):
As you see, there is the main clause here. It means that execution will begin with it, let you enter the desired values of the variables a, b and c, and then enter the method demo.
Placing breakpoints
To place breakpoints, just click the gutter next to the line you want your application to suspend at:
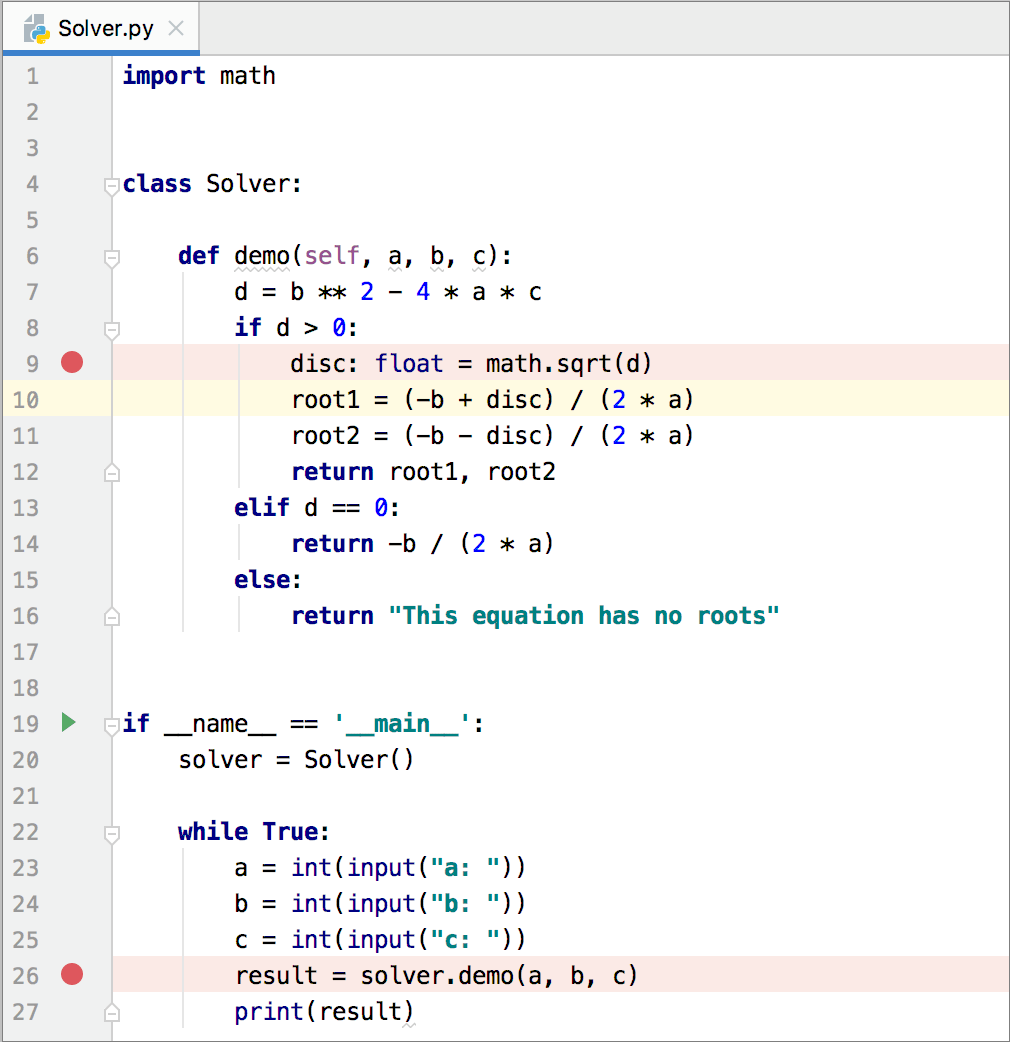
Refer to the section Breakpoints for details.
Starting the debugger session
OK now, as we've added breakpoints, everything is ready for debugging.
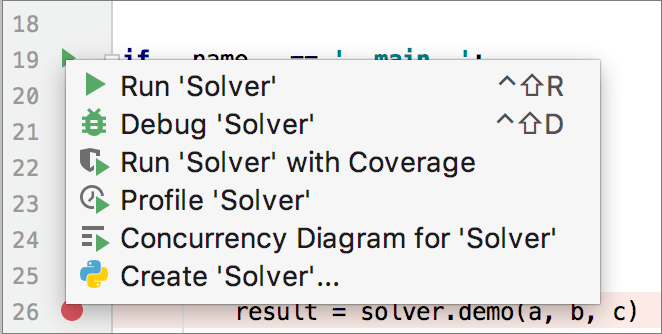
IntelliJ IDEA allows starting the debugger session in several ways. Let's choose one: click ![]() in the gutter, and then select the command in the popup menu that opens:
in the gutter, and then select the command in the popup menu that opens:
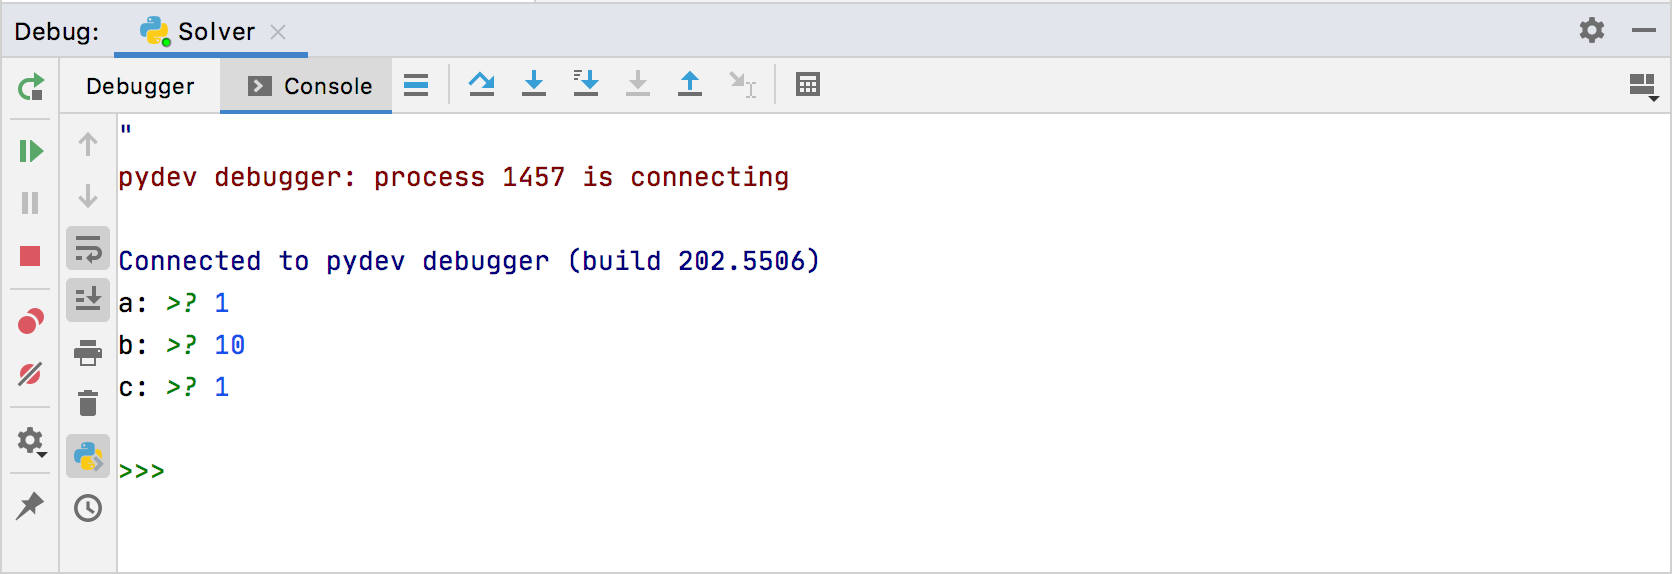
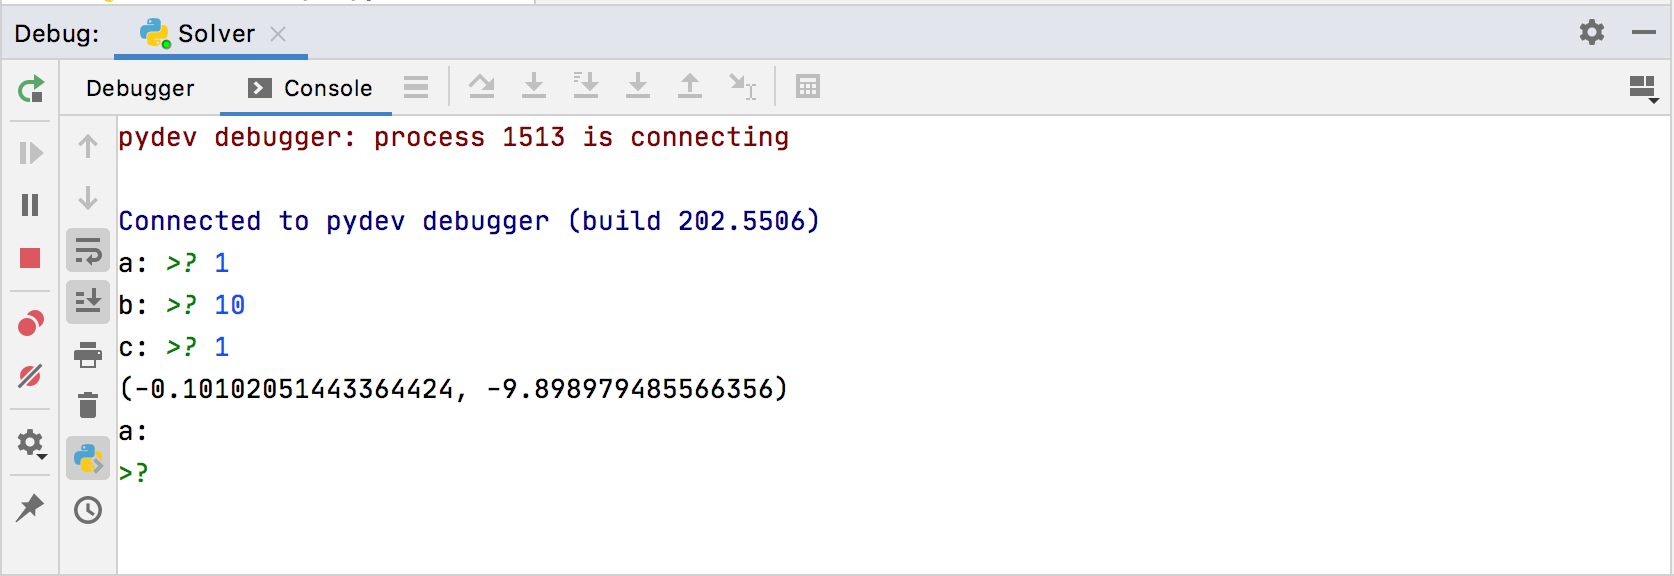
The debugger starts, shows the Console tab of the Debug tool window, and lets you enter the desired values:
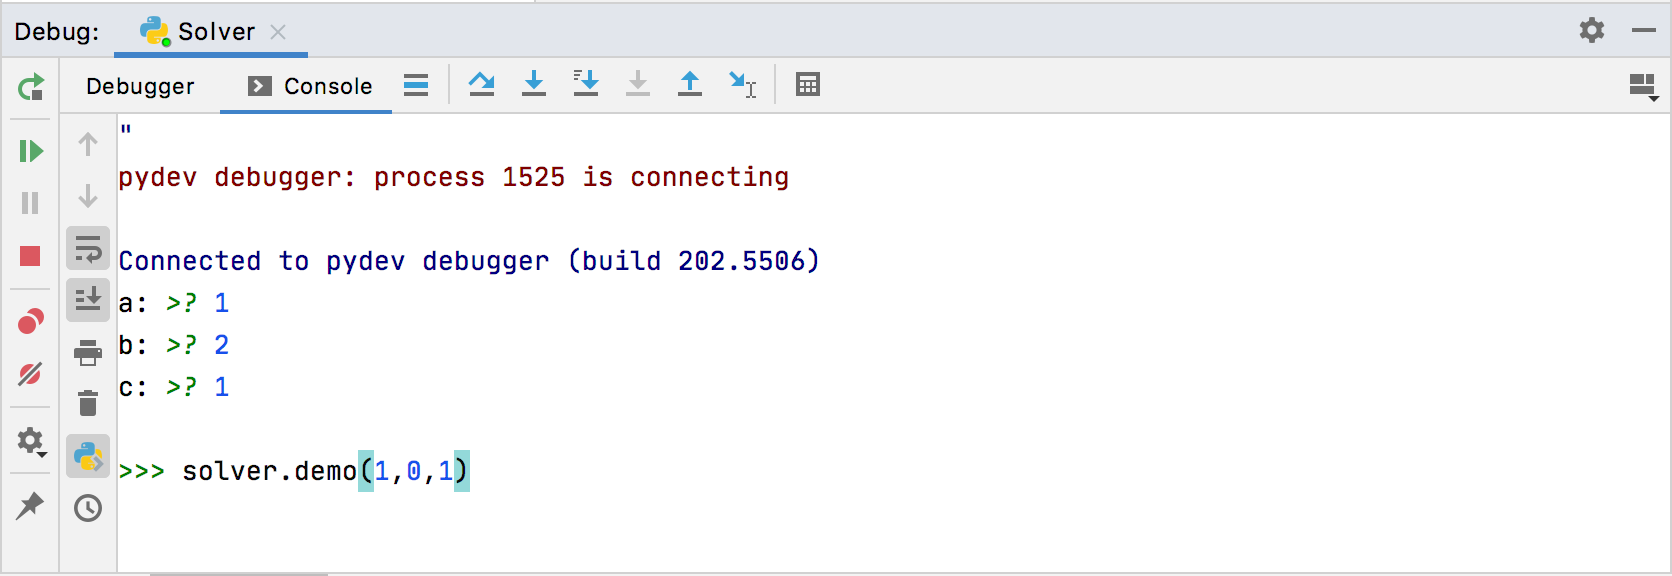
By the way, in the Debug Console, you can enter the Python commands:
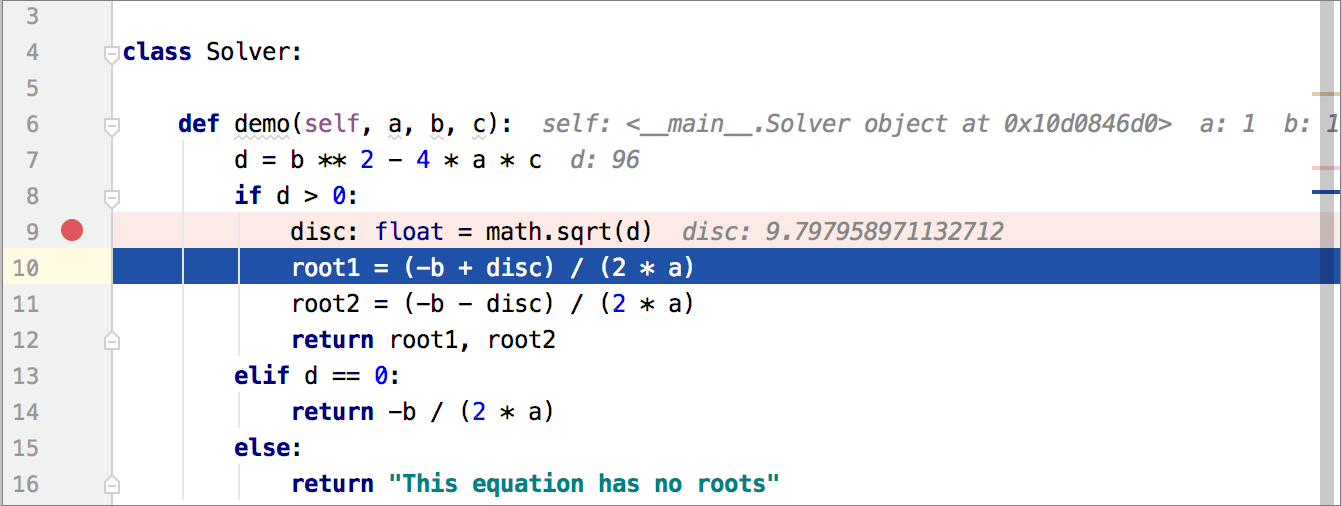
Then the debugger suspends the program at the first breakpoint. It means that the line with the breakpoint is not yet executed. The line becomes blue:

On the stepping toolbar of the Debugger tab, click the button, to move to the next breakpoint.
Inline debugging
In the editor, you see the grey text next to the lines of code:

What does it mean?
This is the result of the so-called inline debugging. The first lines show the address of the Solver object and the values of the variables a, b and c you've entered.
Inline debugging can be turned off.
Note that you can do it in course of the debugger session!
Let's step!
So, you've clicked the button, and now see that the blue marker moves to the next line with the breakpoint.
If you use the stepping toolbar buttons, you'll move to the next line. For example, click the button. Since the inline debugging is enabled, the values of the variables show in italic in the editor.
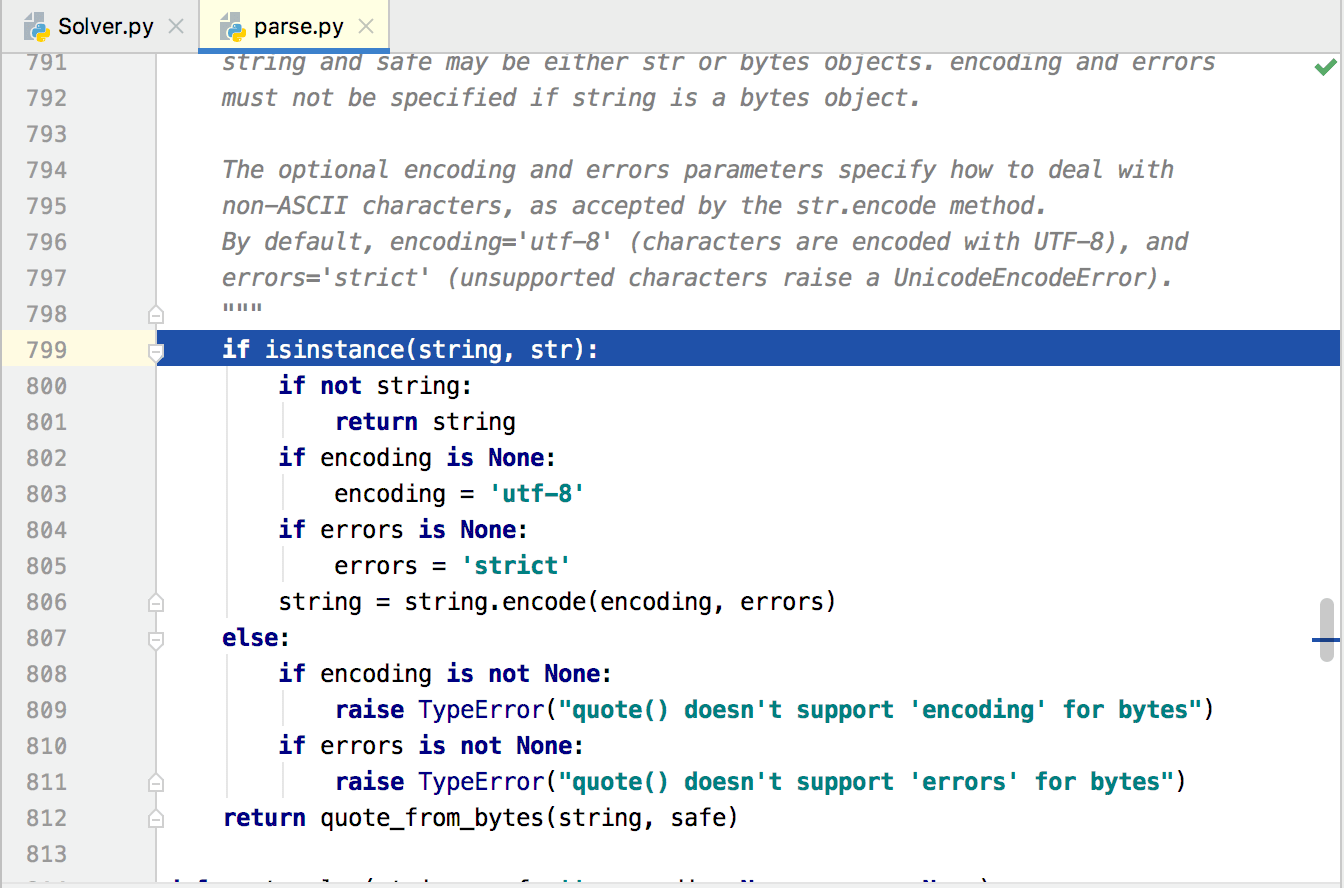
If you click the button, you will see that after the line
a = int(input("a: ")) the debugger goes into the file parse.py:
However, if you continue using the button, you'll see that your application just passes to the next loop:
If you want to concentrate on your own code, use the button Step Into My Code - thus you'll avoid stepping into library classes.
Watching
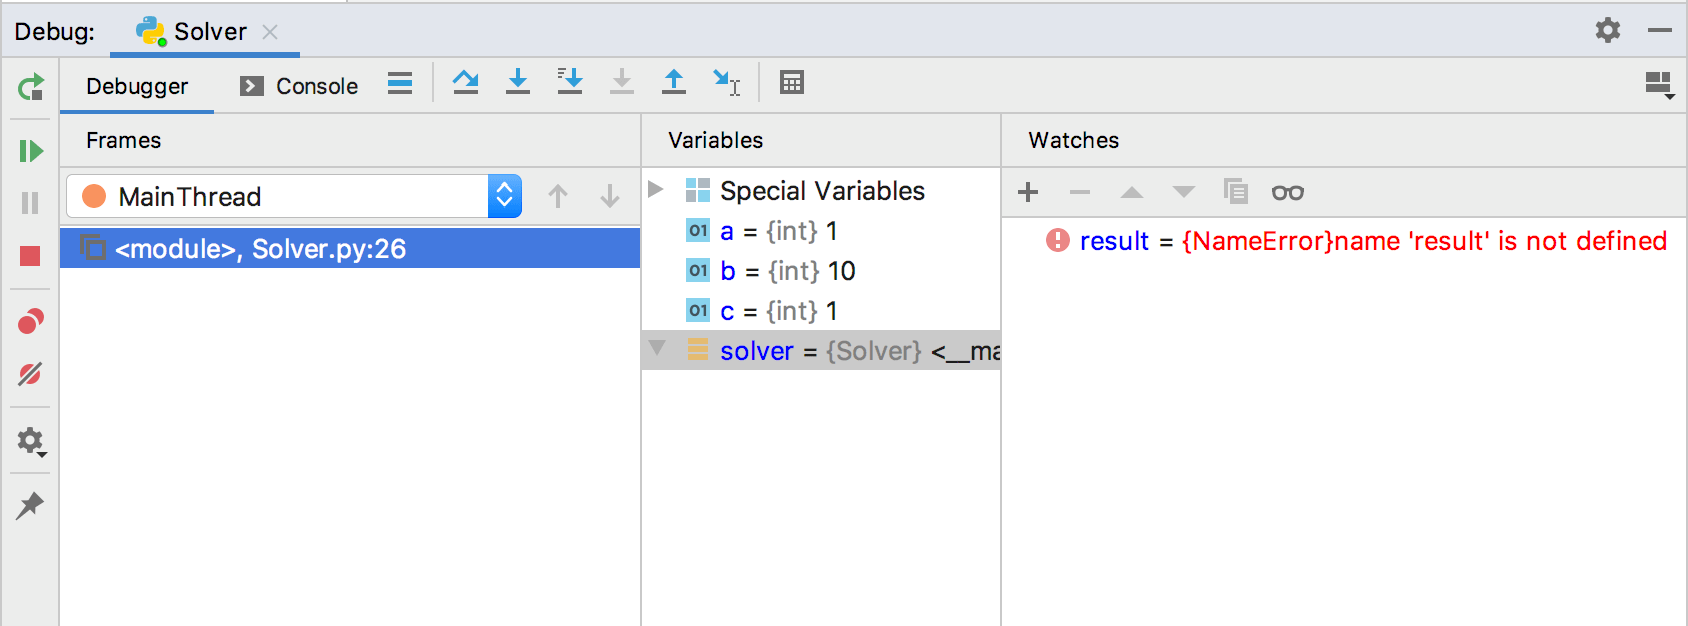
IntelliJ IDEA allows you to watch a variable. Just click on the toolbar of the Variable tab, and type the name of the variable you want to watch. Note that code completion is available:
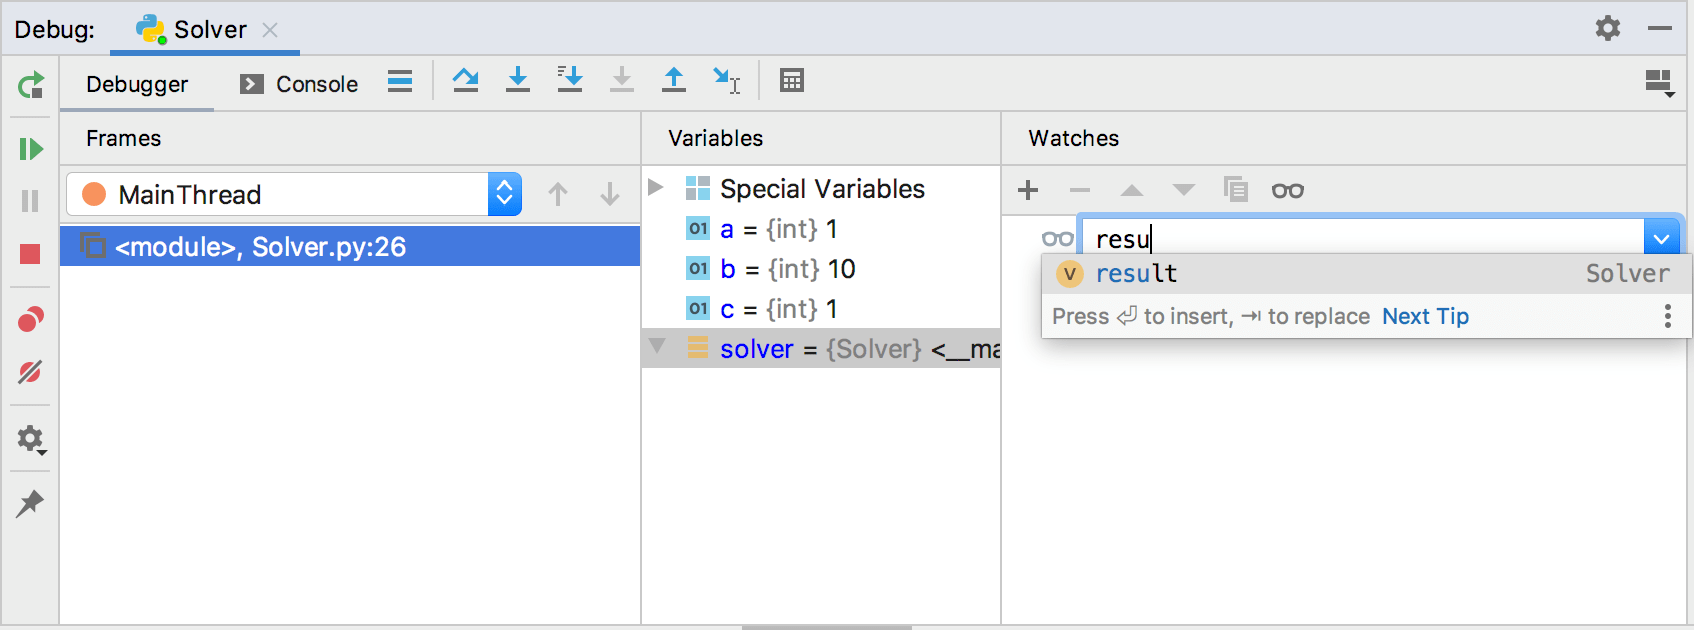
At first, you see an error - it means that the variable is not yet defined:
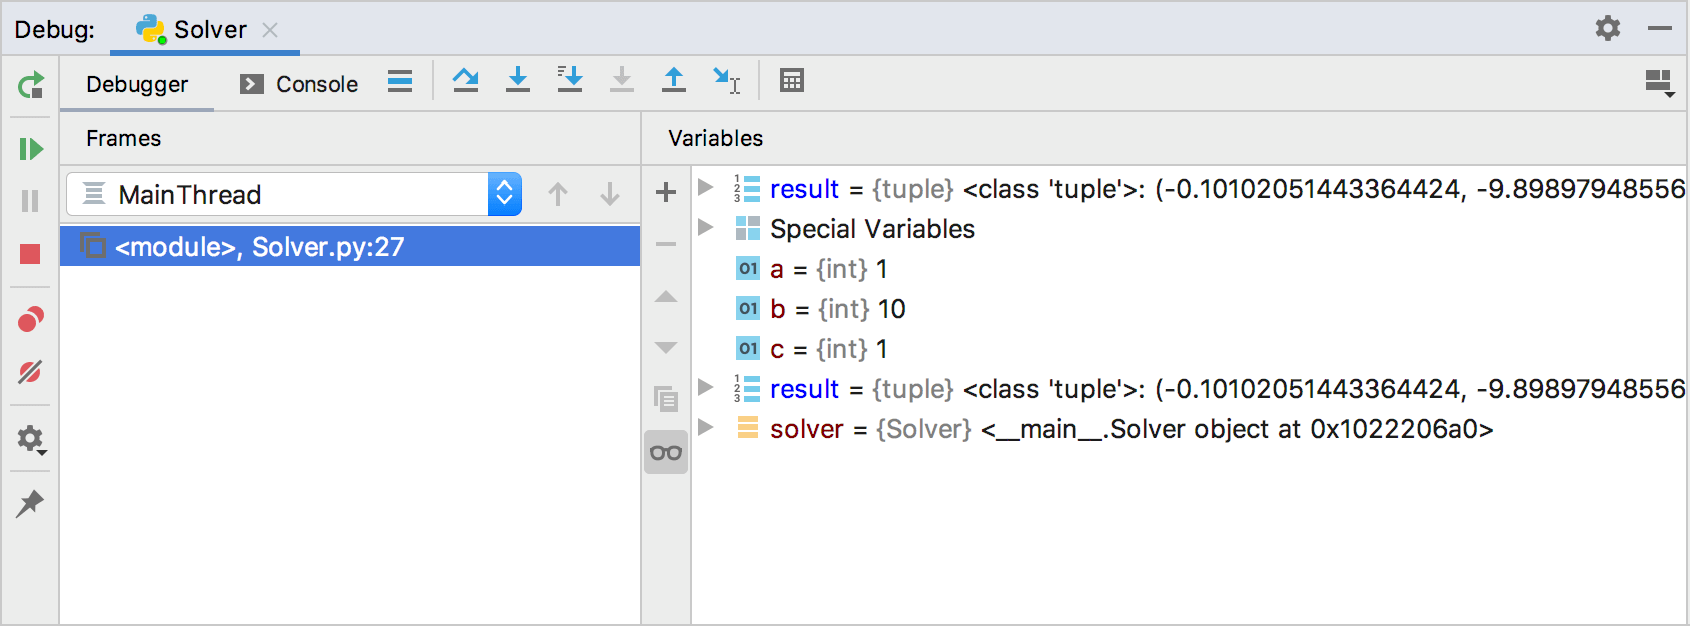
However, when the program execution continues to the scope that defines the variable, the watch gets the following view:
Evaluating expressions
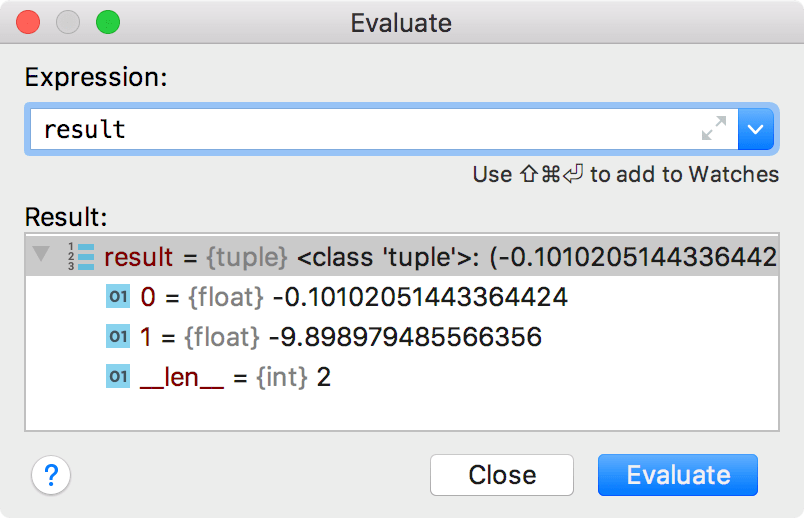
Finally, you can evaluate any expression at any time. For example, if you want to see the value of the variable, click the button , and then in the dialog that opens, click Evaluate:
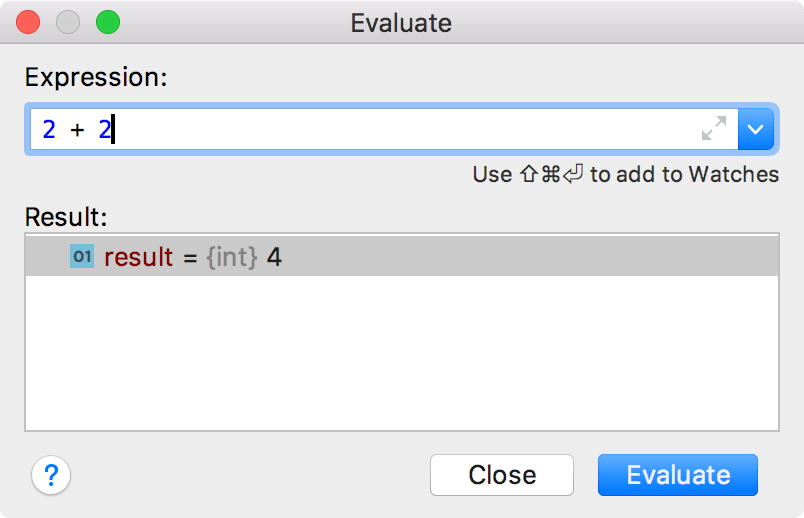
IntelliJ IDEA gives you the possibility to evaluate any expression. For example:
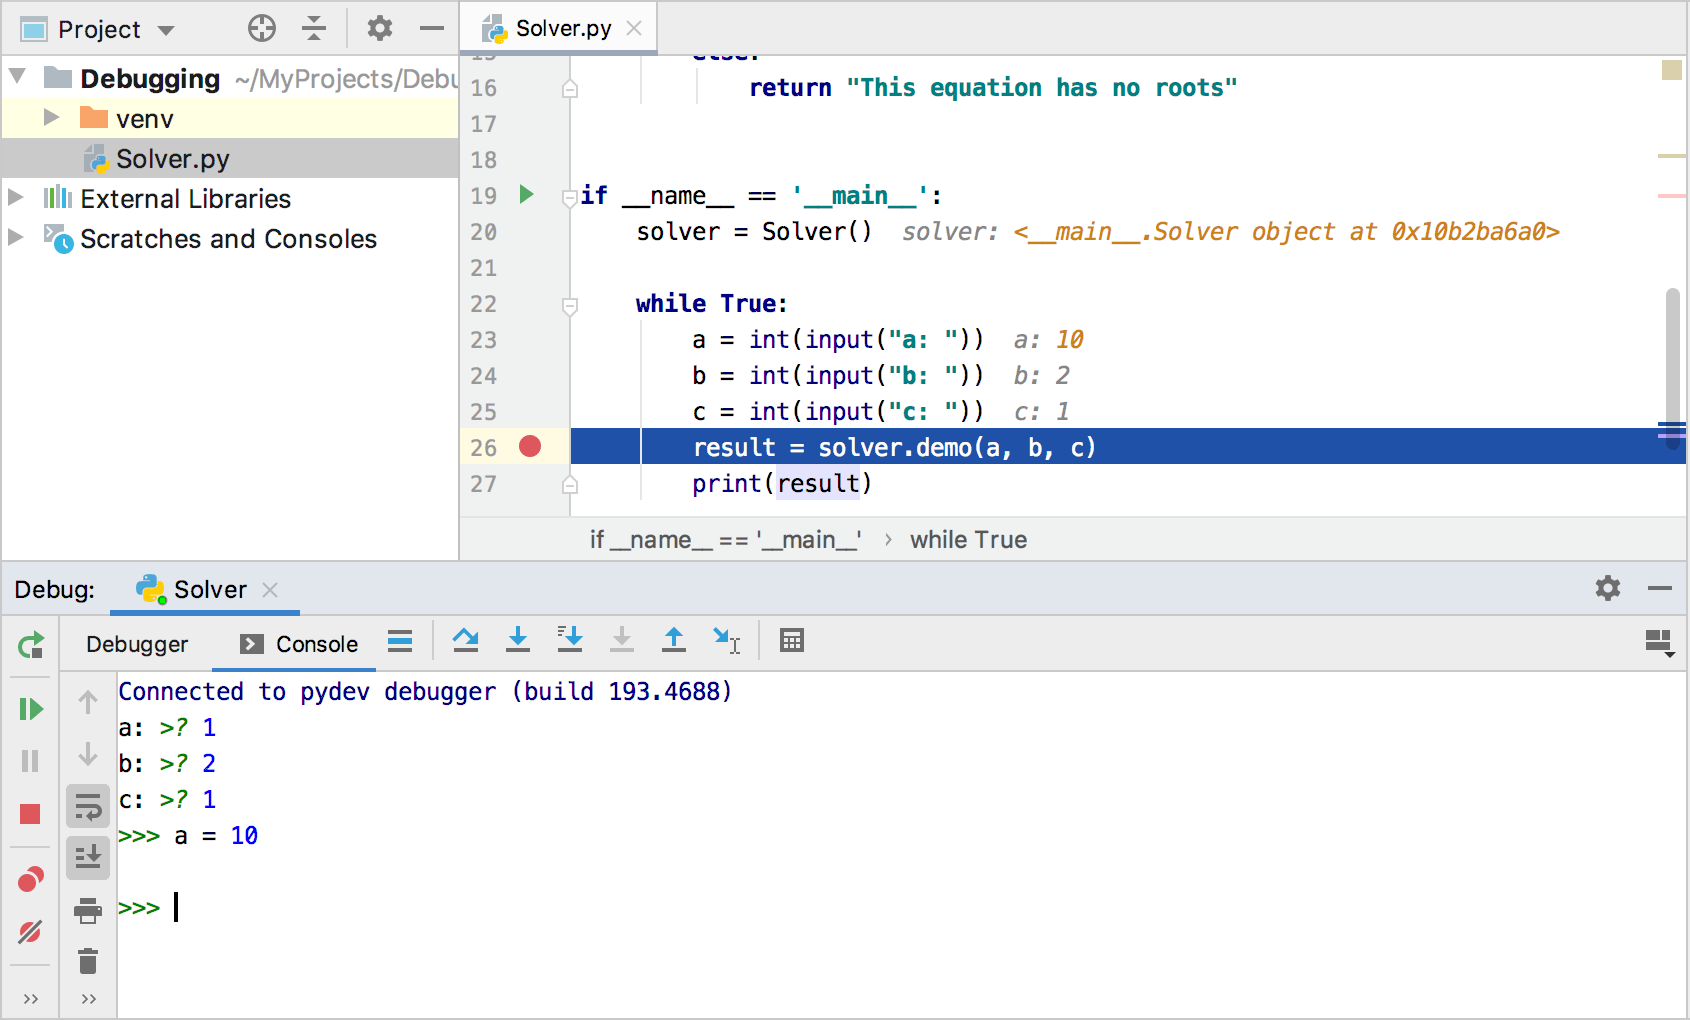
You can enter some commands in the Debug Console to show the variables values. (the icon toggle this mode). For example, you can change the a variable. This change will be shown in the corresponding code in the Editor.
Changing format of the decimal variables
In IntelliJ IDEA debugger, you can preview int variables in the hexadecimal or binary format. This might be particularly helpful when you debug network scripts that include binary protocols.
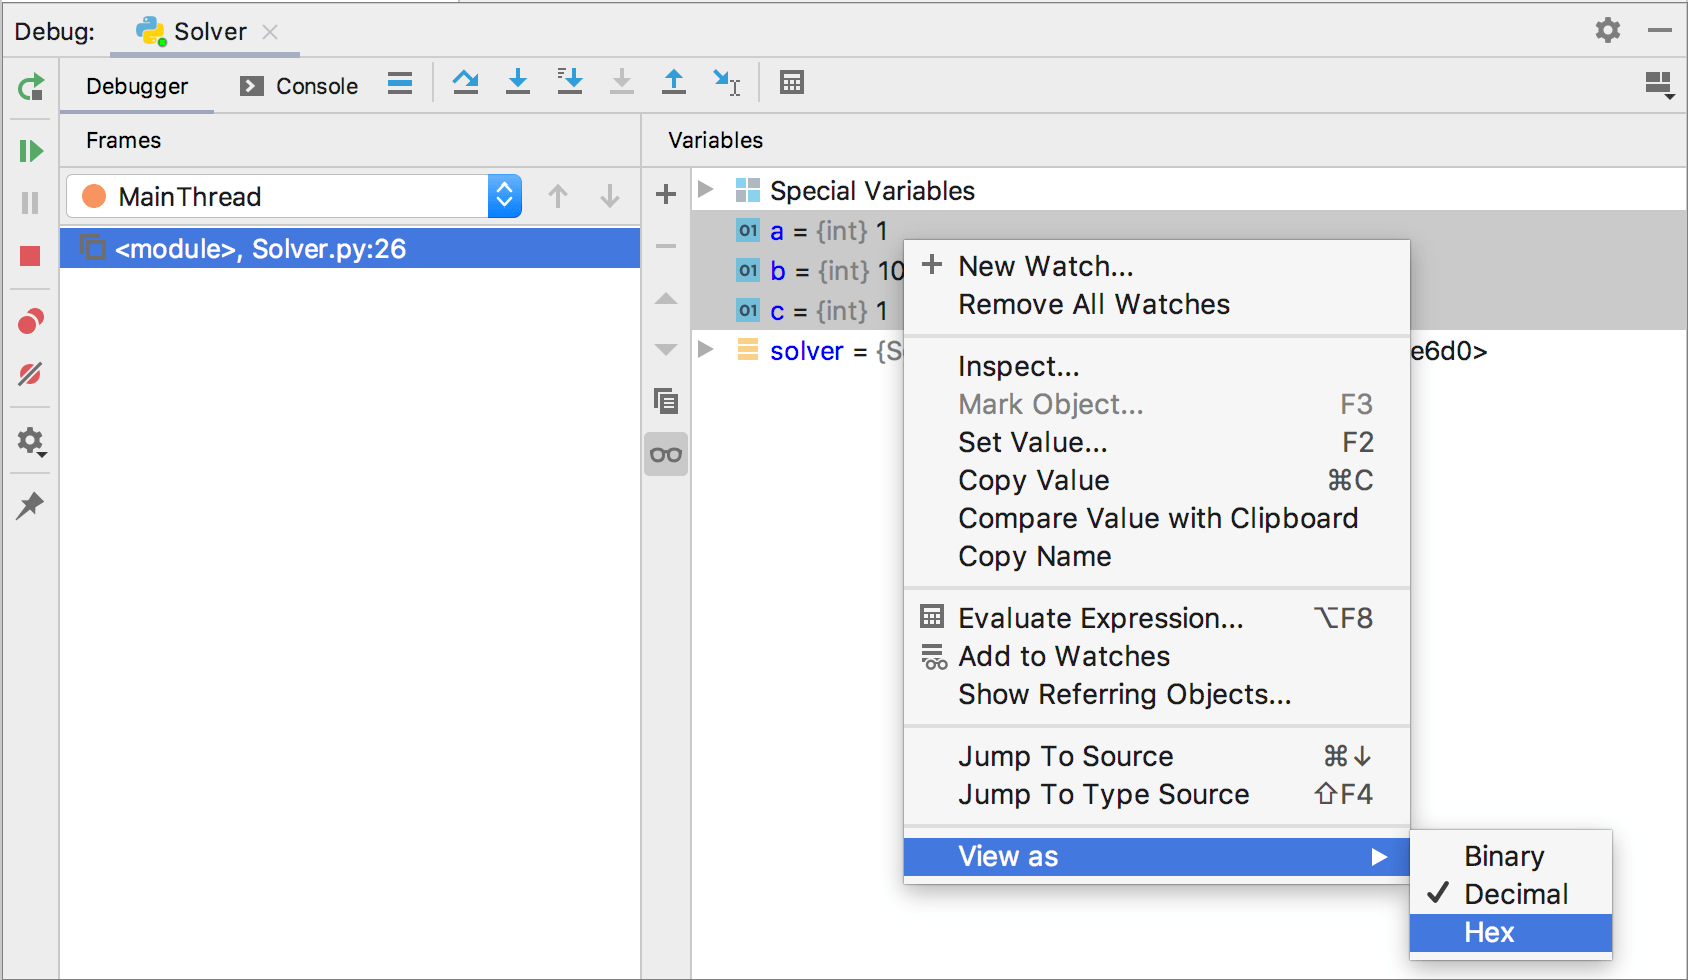
To change the display format, select one or several int variables in the Variables list, right-click, and select from the context menu.
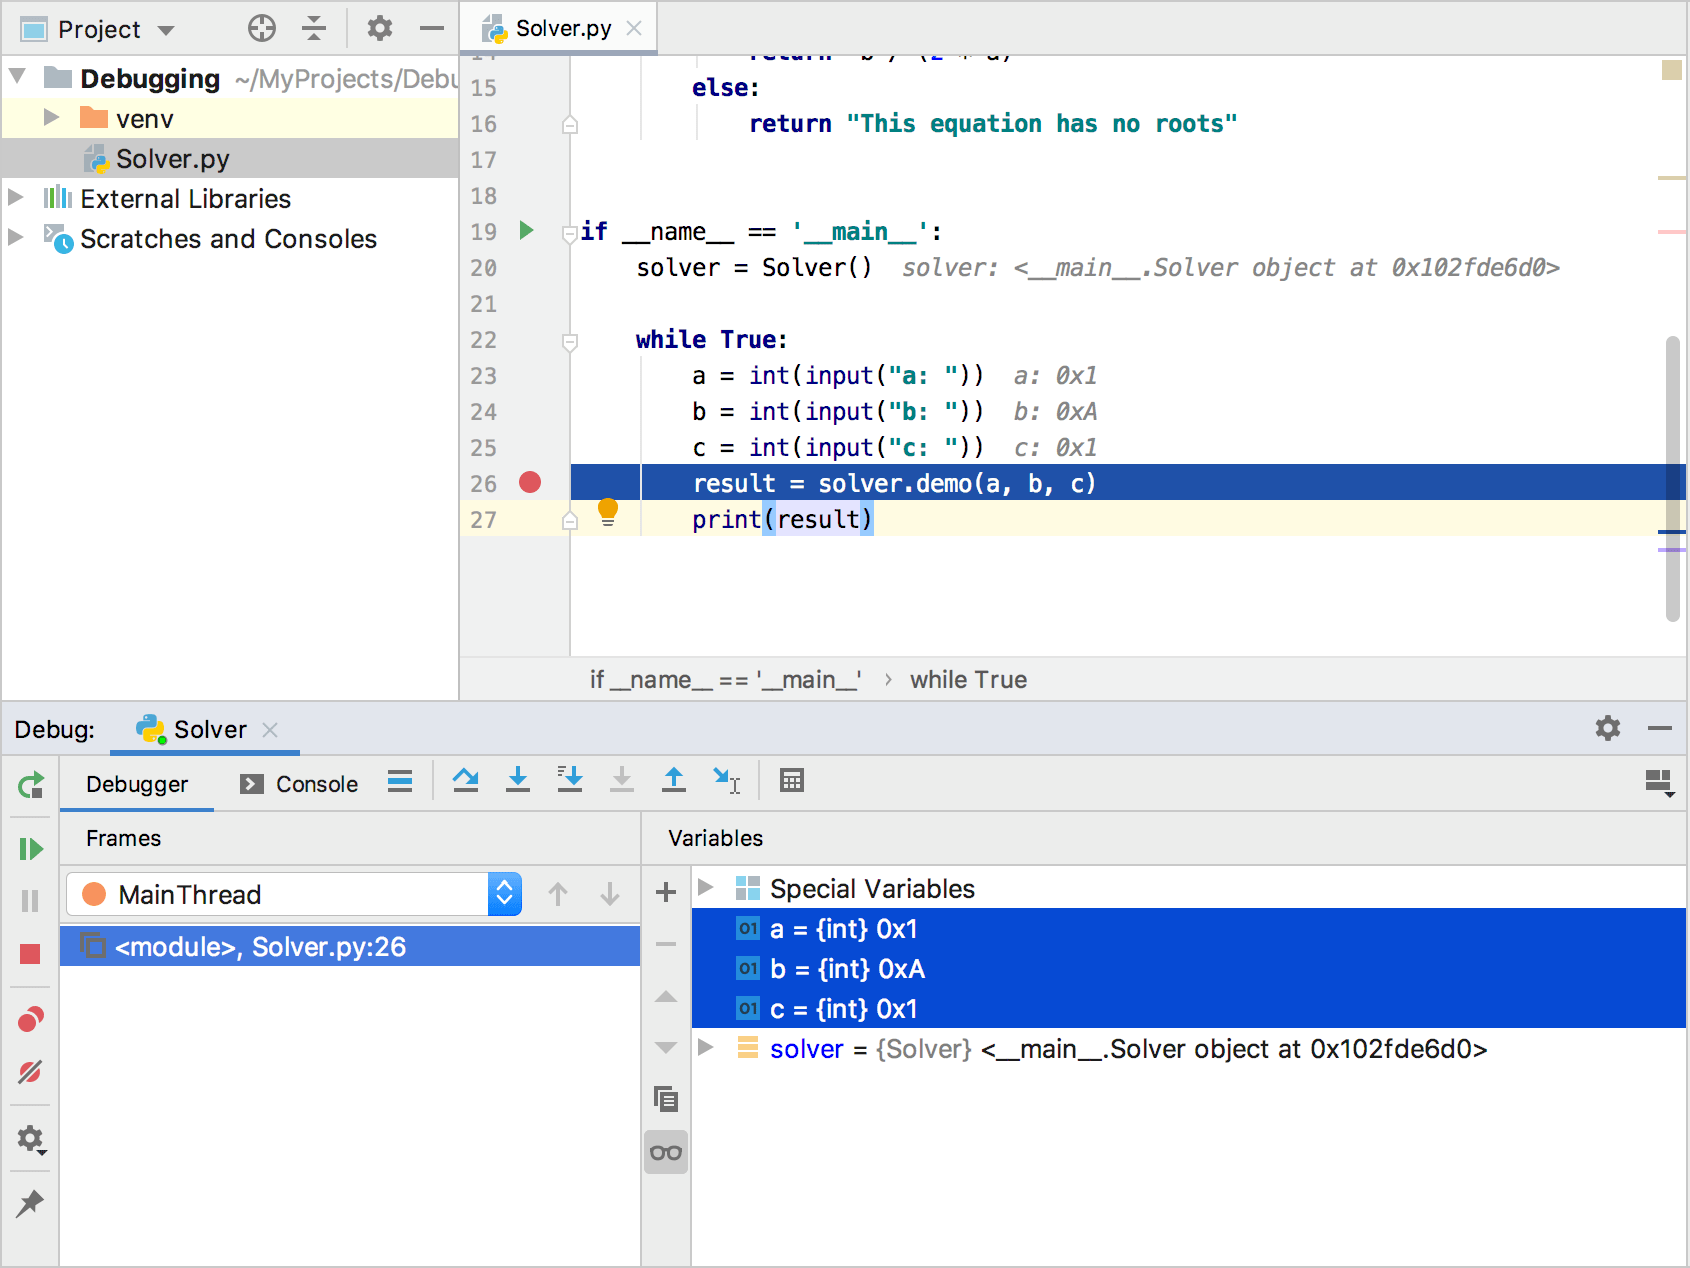
The format of the variables change both in the list of the variables and in the editor.
Summary
This brief tutorial is over - congrats! Let's repeat what you've learnt from it:
You've refreshed your knowledge of the breakpoints and learnt how to place them.
You've learnt how to begin the debugger session, and how to show the Java prompt in the debugger console.
You've refreshed your knowledge about the inline debugging.
You've tried hands on stepping, watches and evaluating expressions.