Step through the program
Stepping is the process of controlling step-by-step execution of the program.
IntelliJ IDEA provides a set of stepping actions, which are used depending on your strategy (for example, whether you need to go directly to the next line or enter the methods invoked on your way there).
The stepping buttons are located on the Debug window toolbar.

Step over
Steps over the current line of code and takes you to the next line even if the highlighted line has method calls in it. The implementation of the methods is skipped, and you move straight to the next line of the caller method.
Click the Step Over button
or press F8.
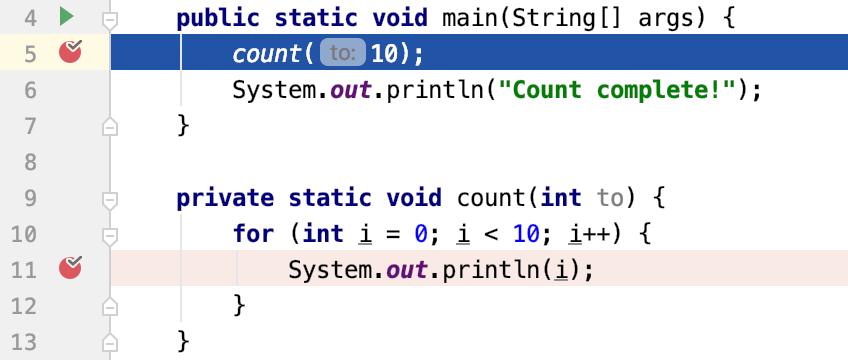
In the example, line 5 is about to be executed. If you step over, the debugger will move straight to line 6 without jumping into the count() method.

If there are breakpoints inside the skipped methods, the debugger will stop at them. To skip any breakpoints on the way, use Force step over.

Step into
Steps into the method to show what happens inside it. Use this option when you are not sure the method is returning a correct result.
Click the Step Into button
or press F7.
In the example, line 5 is about to be executed. If you step into, the debugger will jump into the implementation of the count(int to) method allowing you to examine in detail how its result is produced.

If there are several method calls on the line, IntelliJ IDEA asks you which method to enter. This feature is called Smart step into.

You can configure Smart Step Into to be automatically used every time when there are multiple method calls on the line. Alternatively, it can be invoked only when you expressly do so. To configure this feature, go to and set the Always do smart step into option as required.
Some methods (for example methods of standard Java classes like System) are skipped by Step into as you normally might not need to debug them. This list can be fine-tuned on the page of the Settings dialog (Ctrl+Alt+S).
Smart step into
Smart step into is helpful when there are several method calls on a line, and you want to be specific about which method to enter. This feature allows you to select the method call you are interested in.
From the main menu, select or press Shift+F7.
Click the method. You can also select it using the arrow keys or tabs and press Enter/F7.

You can configure Smart Step Into to be used instead of the regular Step Into every time there are multiple method calls on the line. This is done in .
Step out
Steps out of the current method and takes you to the caller method.
Click the Step Out button
or press Shift+F8.
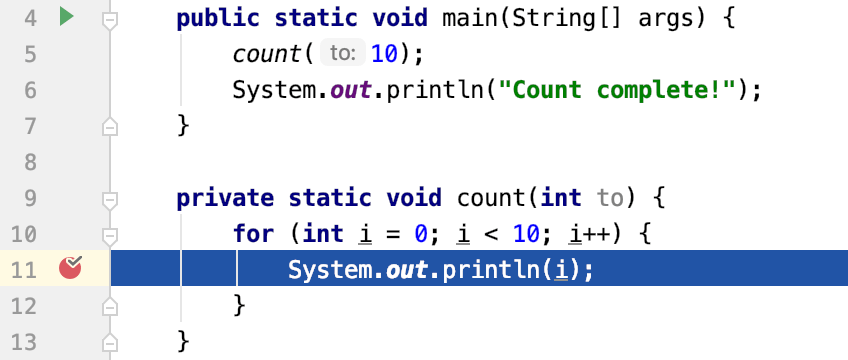
In the example, stepping out skips all iterations of the loop and takes you straight to the main method (the caller).

Step out of code block
Steps out of the currently executed code block. This lets you skip the remaining iterations of while, for and alike without exiting the enclosing method.
From the main menu, select .
In the example, the action exits the for loop and brings us to line 12. Note that the loop was executed anyway, and the output is visible in the console as if we had stepped through each iteration.

Run to cursor
Continues the execution until the position of the caret is reached.
Place the caret at the line where you want the program to pause.
Click the Run to Cursor button
or press Alt+F9.
Also, you can Run to Cursor by clicking the line number in the gutter.

You can configure whether you want Run to Cursor to work on clicking a line number in .
In the example, Run to cursor will continue the execution and stop at line 7 as if there were a breakpoint. If there are breakpoints in the count() method, the program will be suspended there.

To skip any breakpoints on the way, use Force run to cursor.
Force step into
Steps in the method even if this method is skipped by the regular Step Into.
Click the Force step into button
 or press Alt+Shift+F7.
In the example, the execution is suspended right before a line which is about to call System.out.println().

With Force Step Into, we jump right into the implementation of the System.out.println() method, while the regular Step Into would take us to line 20.

Force run to cursor
Continues the execution until the position of the caret is reached. All breakpoints on the way are ignored.
Place the caret at the line where you want the program to pause.
From the main menu, select or press Ctrl+Alt+F9.
In the example, Force run to cursor will continue the execution and stop at line 7 as if there were a breakpoint. The breakpoint inside count() will not have any effect.

Force step over
Steps over the current line of code and takes you to the next line even if the highlighted line has method calls in it. If there are breakpoints in the called methods, they are ignored.
From the main menu, select or press Alt+Shift+F8.
In the example, force stepping over takes you to the print statement on line 6 even though there is a breakpoint in the count() method, which would otherwise, with Step over, suspend the application in all iterations of the loop.

Reset frame
Allows you to undo the last frame and restore the previous frame in the stack. This can be useful, for example, if you've mistakenly stepped too far, or want to re-enter a function where you missed a critical spot.
Note that this option only affects local variables and does not restore the overall program state in that it does not revert values for static and instance variables. This may result in an altered program flow.
Hover over the frame you want to reset, then click the Reset Frame button that appears.

In the example below, dropping the frame returns you to line 5 as if count has never been executed. There are no static or instance variables, which were affected, however the console output, which has been already produced and can be considered a side effect, stays.

Improve stepping speed
Debugger features consume resources and may impact stepping performance. If the performance is not satisfactory, follow the recommendations provided in this chapter to optimize it.
Use the Overhead feature to identify the cause(s) of performance degradation.
Disable or minimize the use of the following features if they are not required for your project:
The Show method return values option
The Alternate view for Collections classes option ()
'toString' object view ()
Simplify the conditions for breakpoints and watchpoints, especially frequently hit ones.
During the debugging session, switch to a view with fewer elements.
Configure stepping behavior
Press Ctrl+Alt+S to open the IDE settings and select .
Configure the stepping behavior as required. For information on particular options, refer to the table below.
Option | Description |
|---|---|
Skip synthetic methods | Select this checkbox to suppress stepping into synthetic methods (methods generated by the compiler) while debugging. |
Skip constructors | Select this checkbox to suppress stepping into constructors while debugging. |
Skip class loaders | Select this checkbox to suppress stepping into class loaders while debugging. |
Skip simple getters | Select this checkbox to suppress stepping into simple getter methods (that is, methods designed just to return the necessary value) while debugging. |
Do not step into the classes | Select this checkbox to suppress stepping into the specified classes while debugging. The list of classes contains entries of two types:
By default, the list contains some standard Java SDK class patterns so that you do not have to waste your time stepping into Java class libraries. Use the checkboxes in the list to disable/enable particular patterns temporarily. Use the |
Evaluate finally blocks on pop frame | Select whether you want to evaluate |
Resume only the current thread | Select this checkbox, if you need to resume only the active thread when stepping. |