Get started with a Rails project in IntelliJ IDEA
IntelliJ IDEA is an integrated development environment (IDE) that helps you be more productive in every aspect of Ruby/Rails projects development - from writing and debugging code to testing and deploying a completed application. IntelliJ IDEA is available for different platforms including macOS, Windows, and Linux.
In this tutorial, we’ll show you the main IntelliJ IDEA capabilities using a fork of a sample application created for the Ruby on Rails Tutorial. Before starting this tutorial, do the following:
Install Git.
Install the Ruby distribution for your platform.
We'll perform all steps using IntelliJ IDEA installed on macOS.
Open a project
First of all, we need to clone the repository containing the sample application:
Run IntelliJ IDEA and click Get from Version Control on the Welcome Screen.

In the Get from Version Control dialog, do the following:

Make sure that Git is selected in the Version control field.
Insert the following address to the URL field:
https://github.com/JetBrains/sample_rails_app.git
Click the Clone button. IntelliJ IDEA will show a progress bar indicating a cloning process.

After cloning the repository, IntelliJ IDEA opens the directory and starts the indexing process. You can see the progress in the Status Bar.

IntelliJ IDEA indexes your project to analyze its sources and collects the information on available files, class and method definitions, and so on. This is required for code insight features such as code completion and navigation.
Select the Ruby interpreter and install gems
After you’ve opened the project, it is necessary to select the required Ruby interpreter and install the dependencies specified in the project's Gemfile:
Go to , or press Ctrl+Alt+Shift+S.
In the invoked Project Structure dialog, switch to the Modules page and select the Ruby interpreter.

Click OK.
Now, let’s install the gems specified in the Gemfile. IntelliJ IDEA allows you to use Bundler to manage gems. Press Ctrl twice and start typing bundle install. Then, select the bundle install command from the list and press Enter.

(Optional) If the current project interpreter does not have the required Bundler version specified in Gemfile.lock, IntelliJ IDEA suggests installing it.
In the Bundle Install dialog, add the following argument:
--without productionThen, click Install.

Wait until IntelliJ IDEA installs all gems.

Install JavaScript dependencies
To install JavaScript dependencies mentioned in the project's package.json file using Yarn, do the following:
Press Ctrl twice again and start typing yarn install. Then, select the yarn install command from the list and press Enter.

Wait until IntelliJ IDEA installs all packages.

Run migrations
Before running our Rails application, we need to migrate the database.
Press Ctrl twice and type db:migrate. Select
rake db:migratein the dropdown and press Enter.
Leave the default settings in the invoked Execute ‘db:migrate’ dialog and click OK.

This creates the development.sqlite3 database in the db folder.
Run
rake db:migrateone more time as described in the first step. This time, set the Environment option to test in the Execute ‘db:migrate’ dialog and click OK. The created test.sqlite3 database will be used to run tests.
Navigate through a project
IntelliJ IDEA provides rich navigation capabilities to explore projects of any sizes. You can navigate between files, go to declarations, search entities of any types, and so on.
Project view
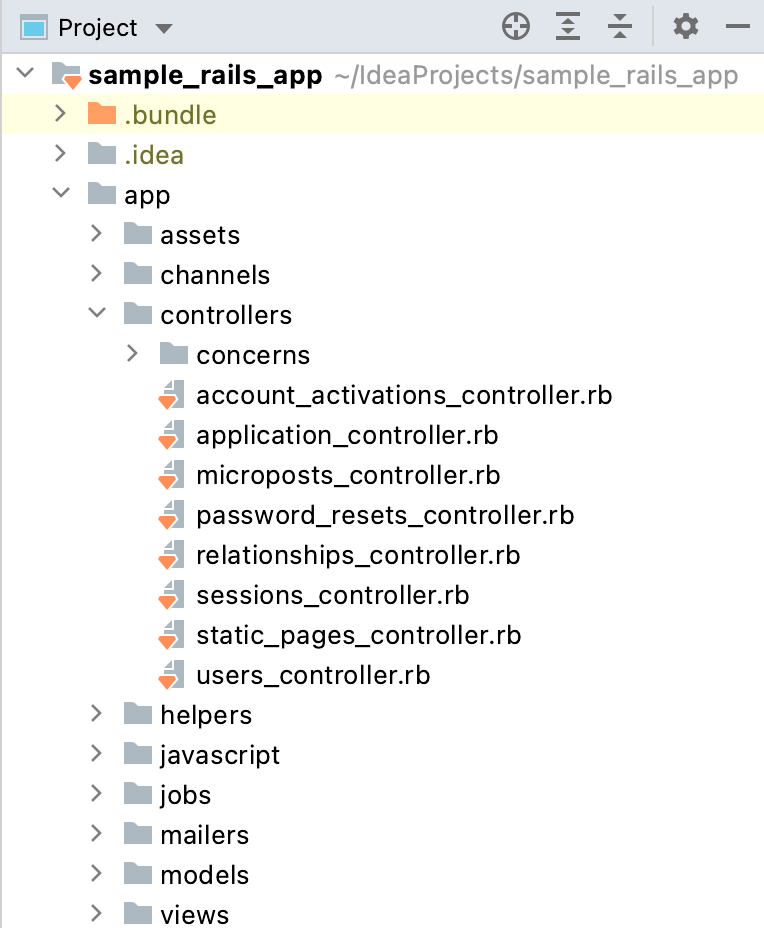
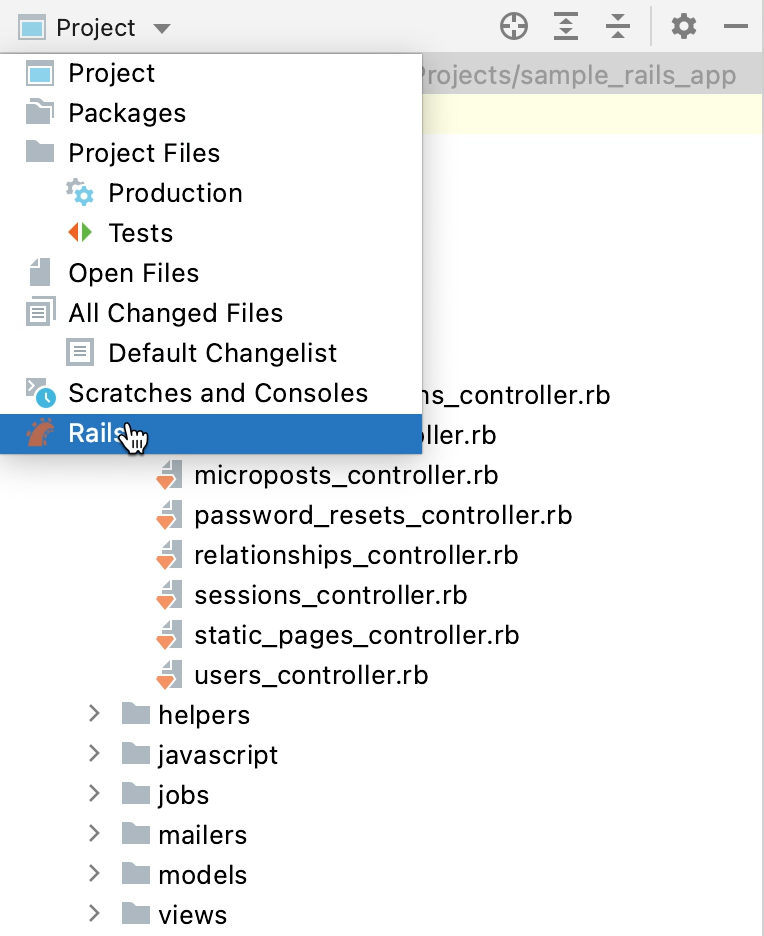
The Project view (Alt+1) on the left side of the IDE displays the project structure. You can use it to open any file in your project, create new files, and so on.
Go to declaration
Go to declaration allows you to navigate to the declaration of a symbol from any symbol usage. To see this capability in action, press Ctrl+Shift+N, start typing users_controller, select the users_controller.rb file and click Enter.

In the opened app/controllers/users_controller.rb file, place the caret next to the User class and press Ctrl+B.
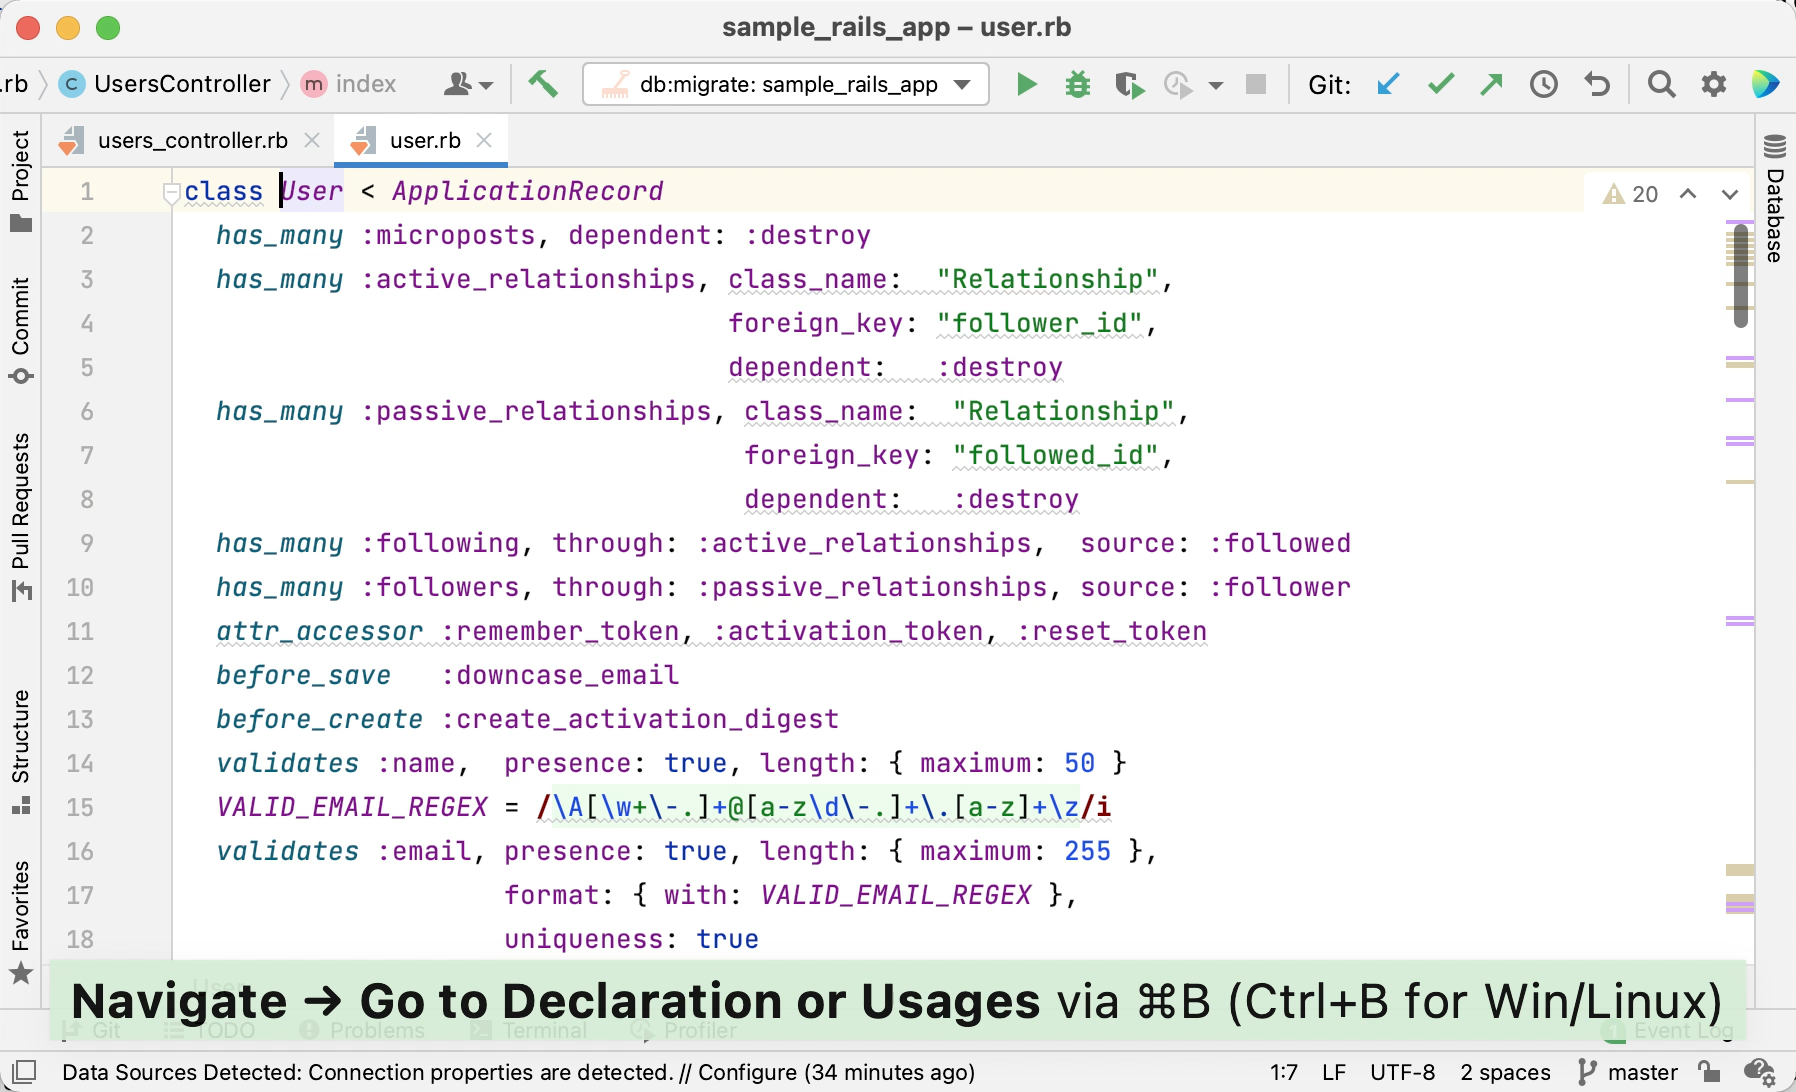
You'll jump to the class declaration in the user.rb file.
Note that you can jump not only to project entities but to definitions within external libraries (which are gems in our case). For instance, keeping Ctrl pressed, hover your mouse pointer over the has_many method. When the method turns into a hyperlink, click it without releasing the key.
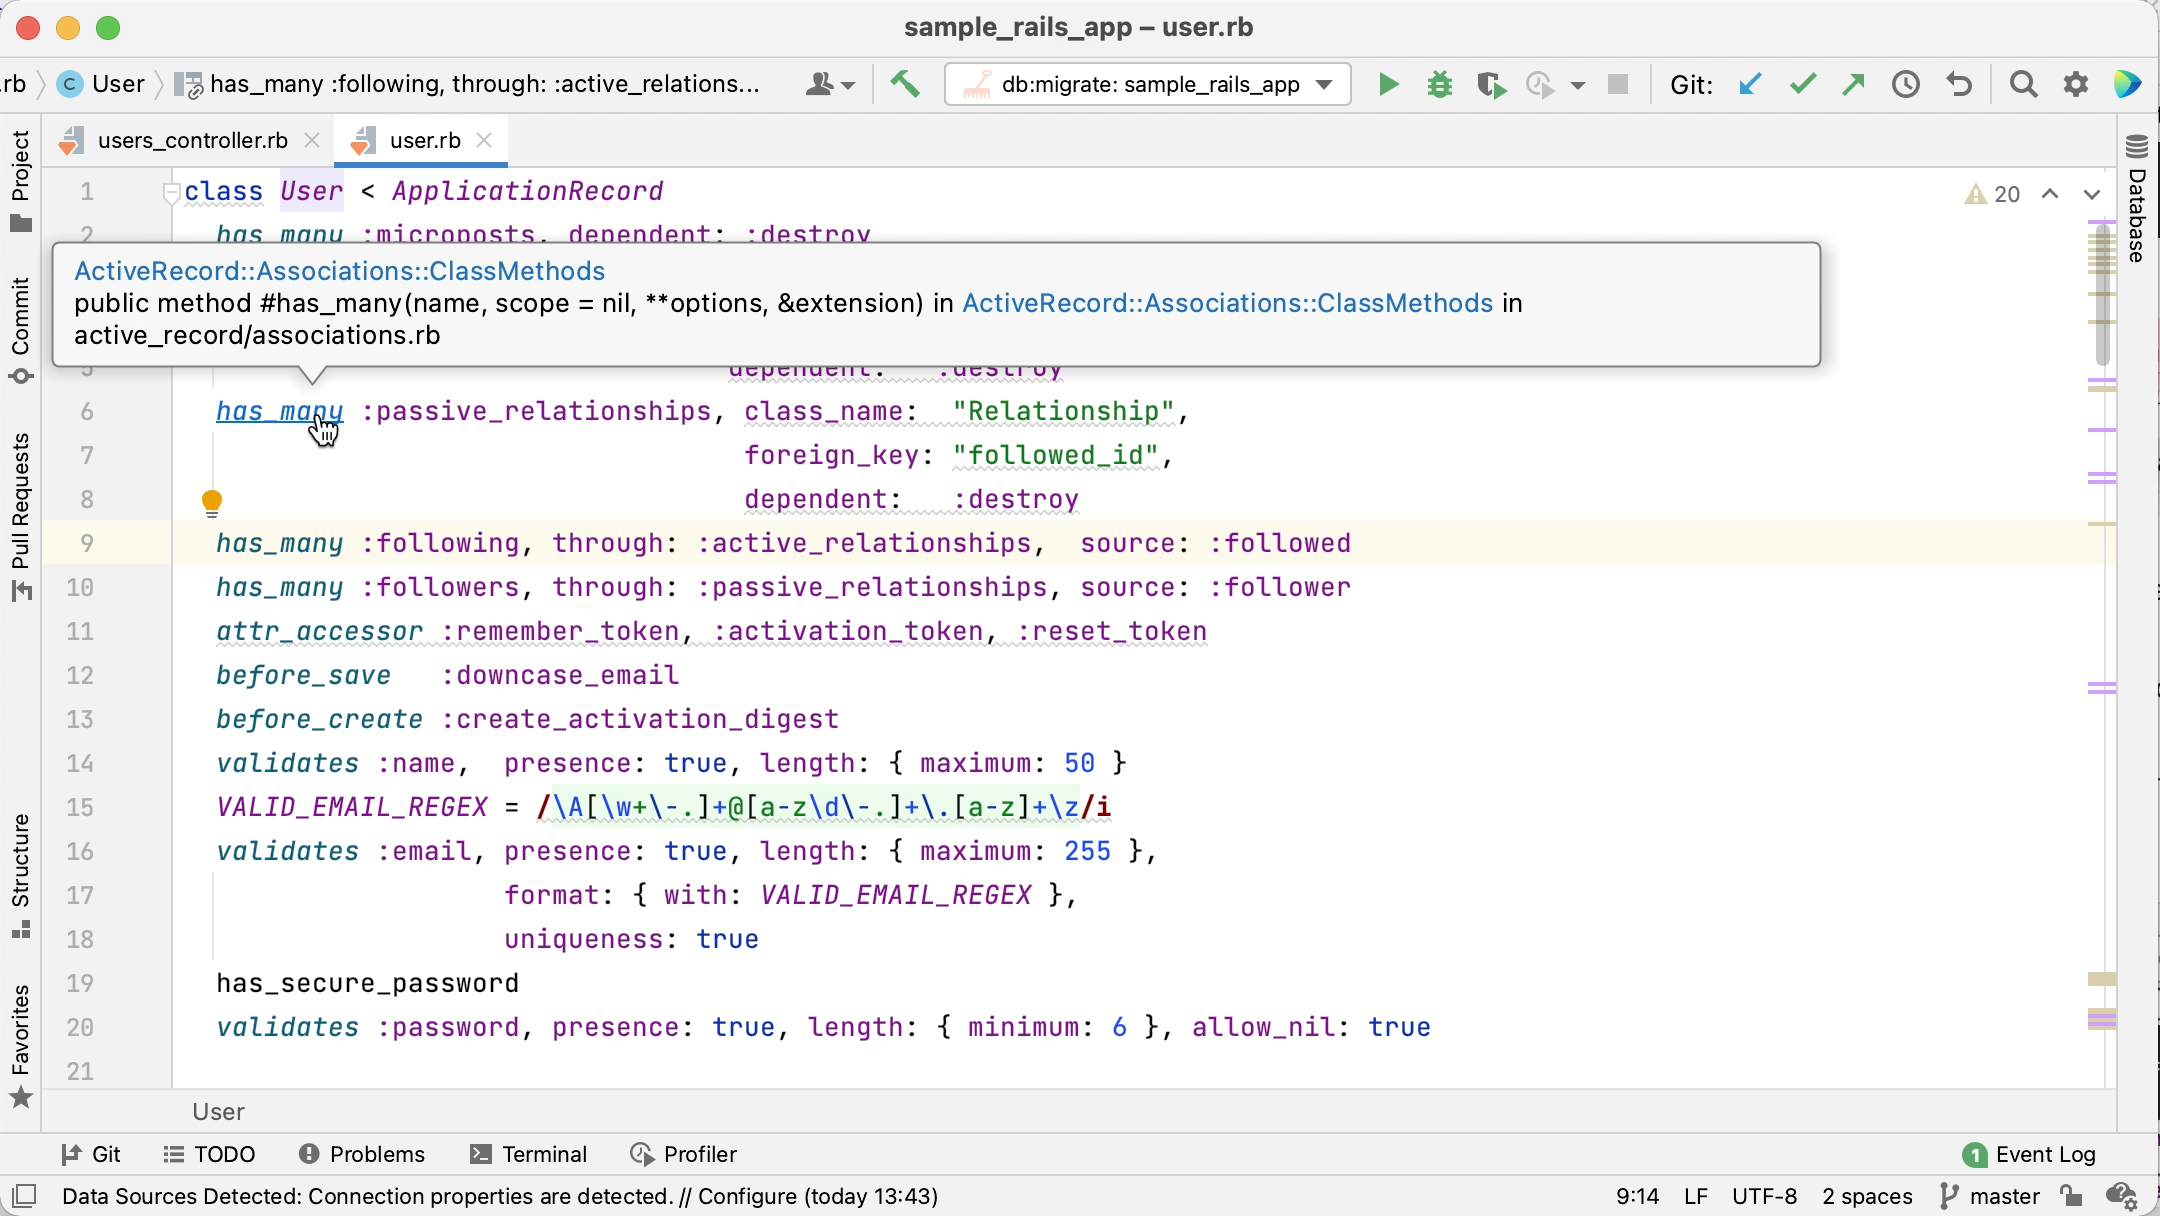
IntelliJ IDEA will open the method definition within the ActiveRecord Rails module.
Find usages
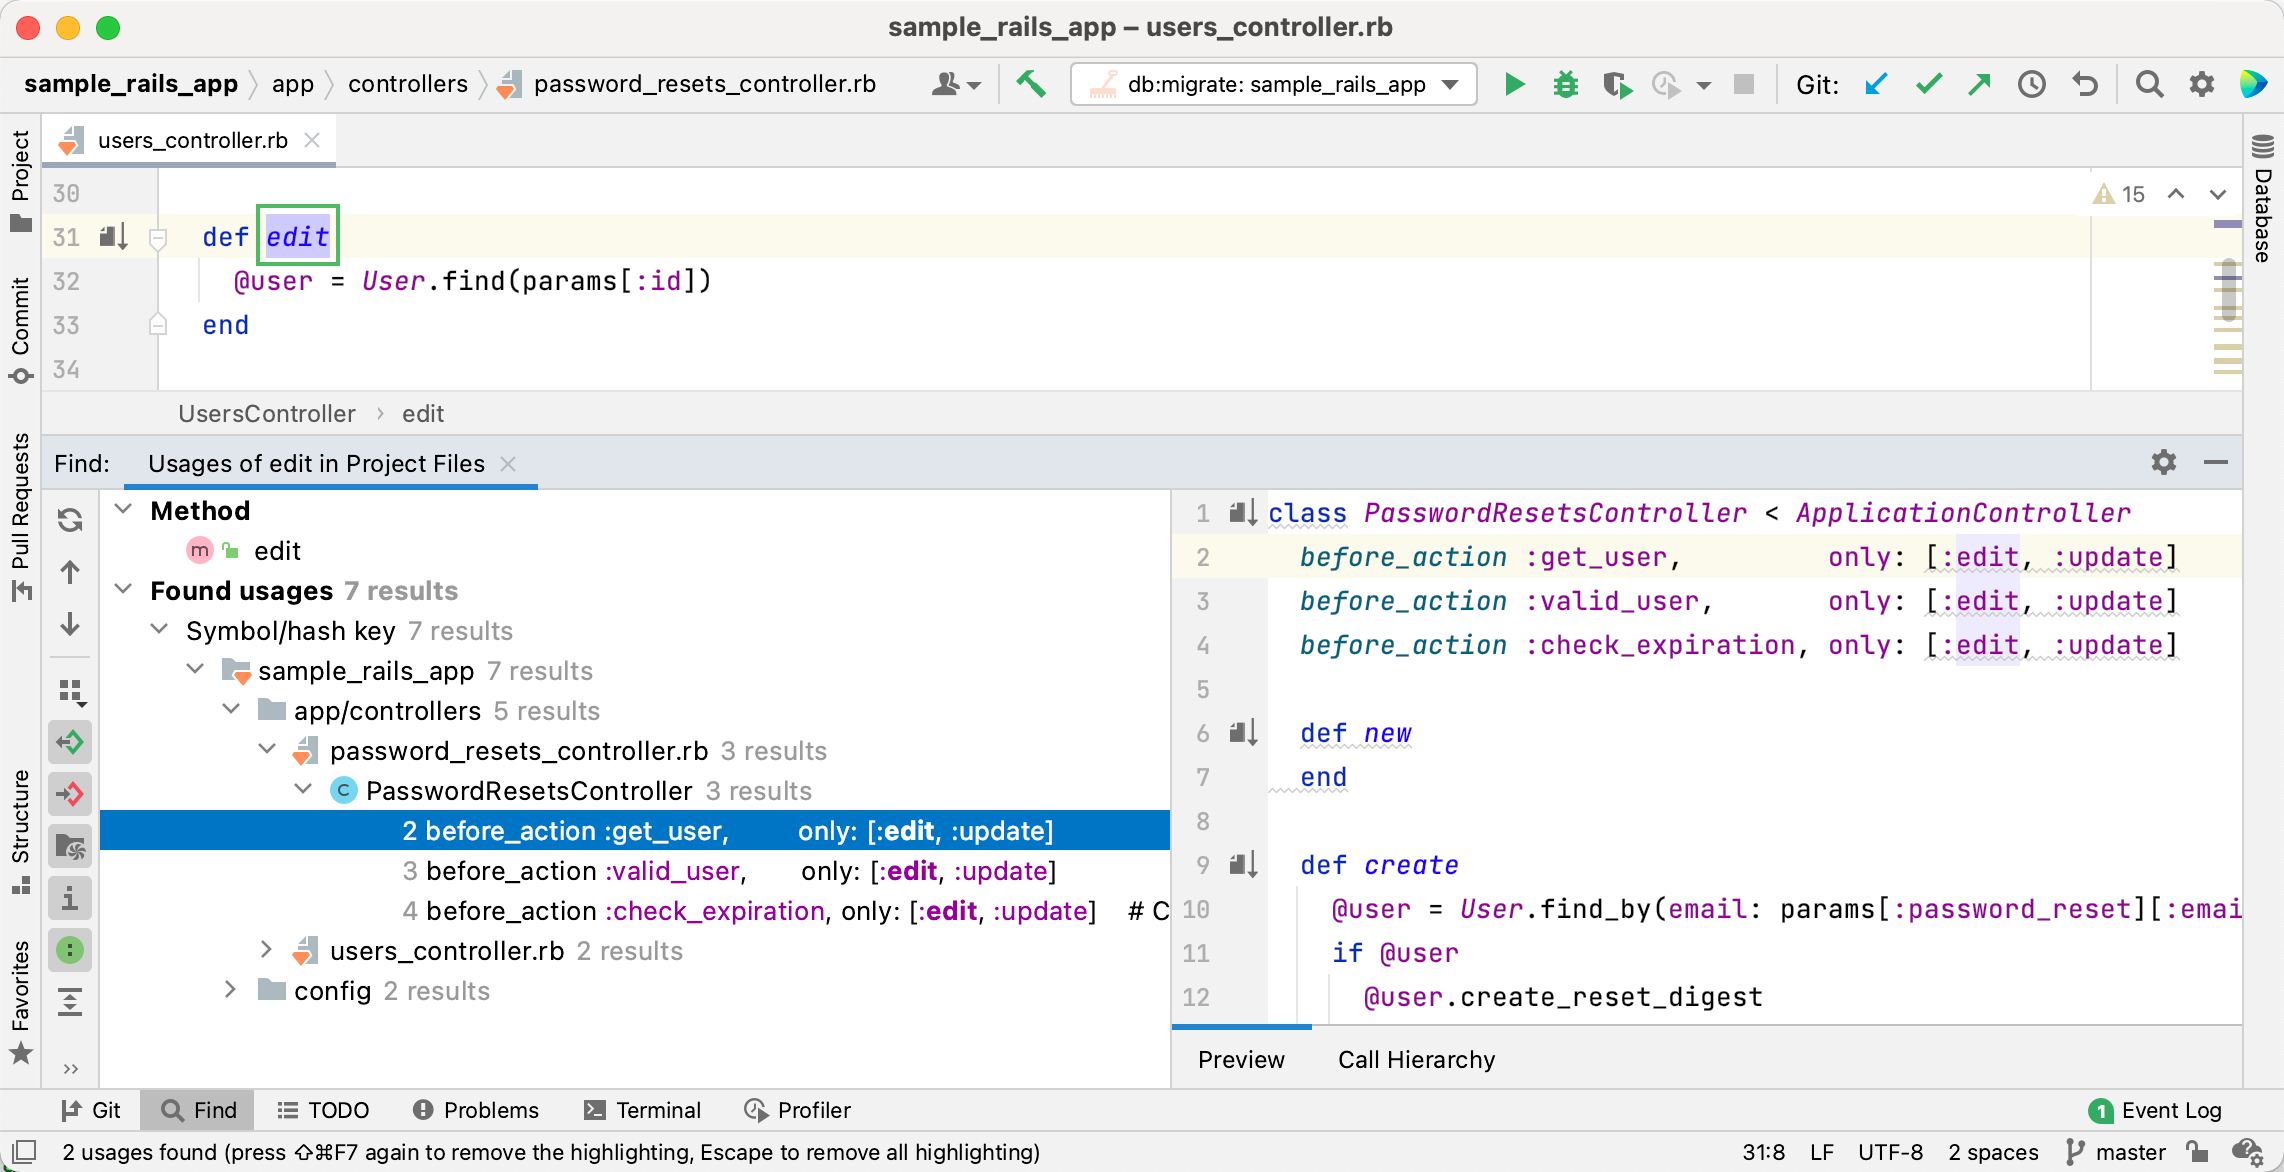
Let’s demonstrate the Find usages feature. In the app/controllers/users_controller.rb file, scroll down to the edit action, place the caret next to it and press Alt+F7. In the Find window, you can explore the places where this action is used.
Navigate between Rails entities
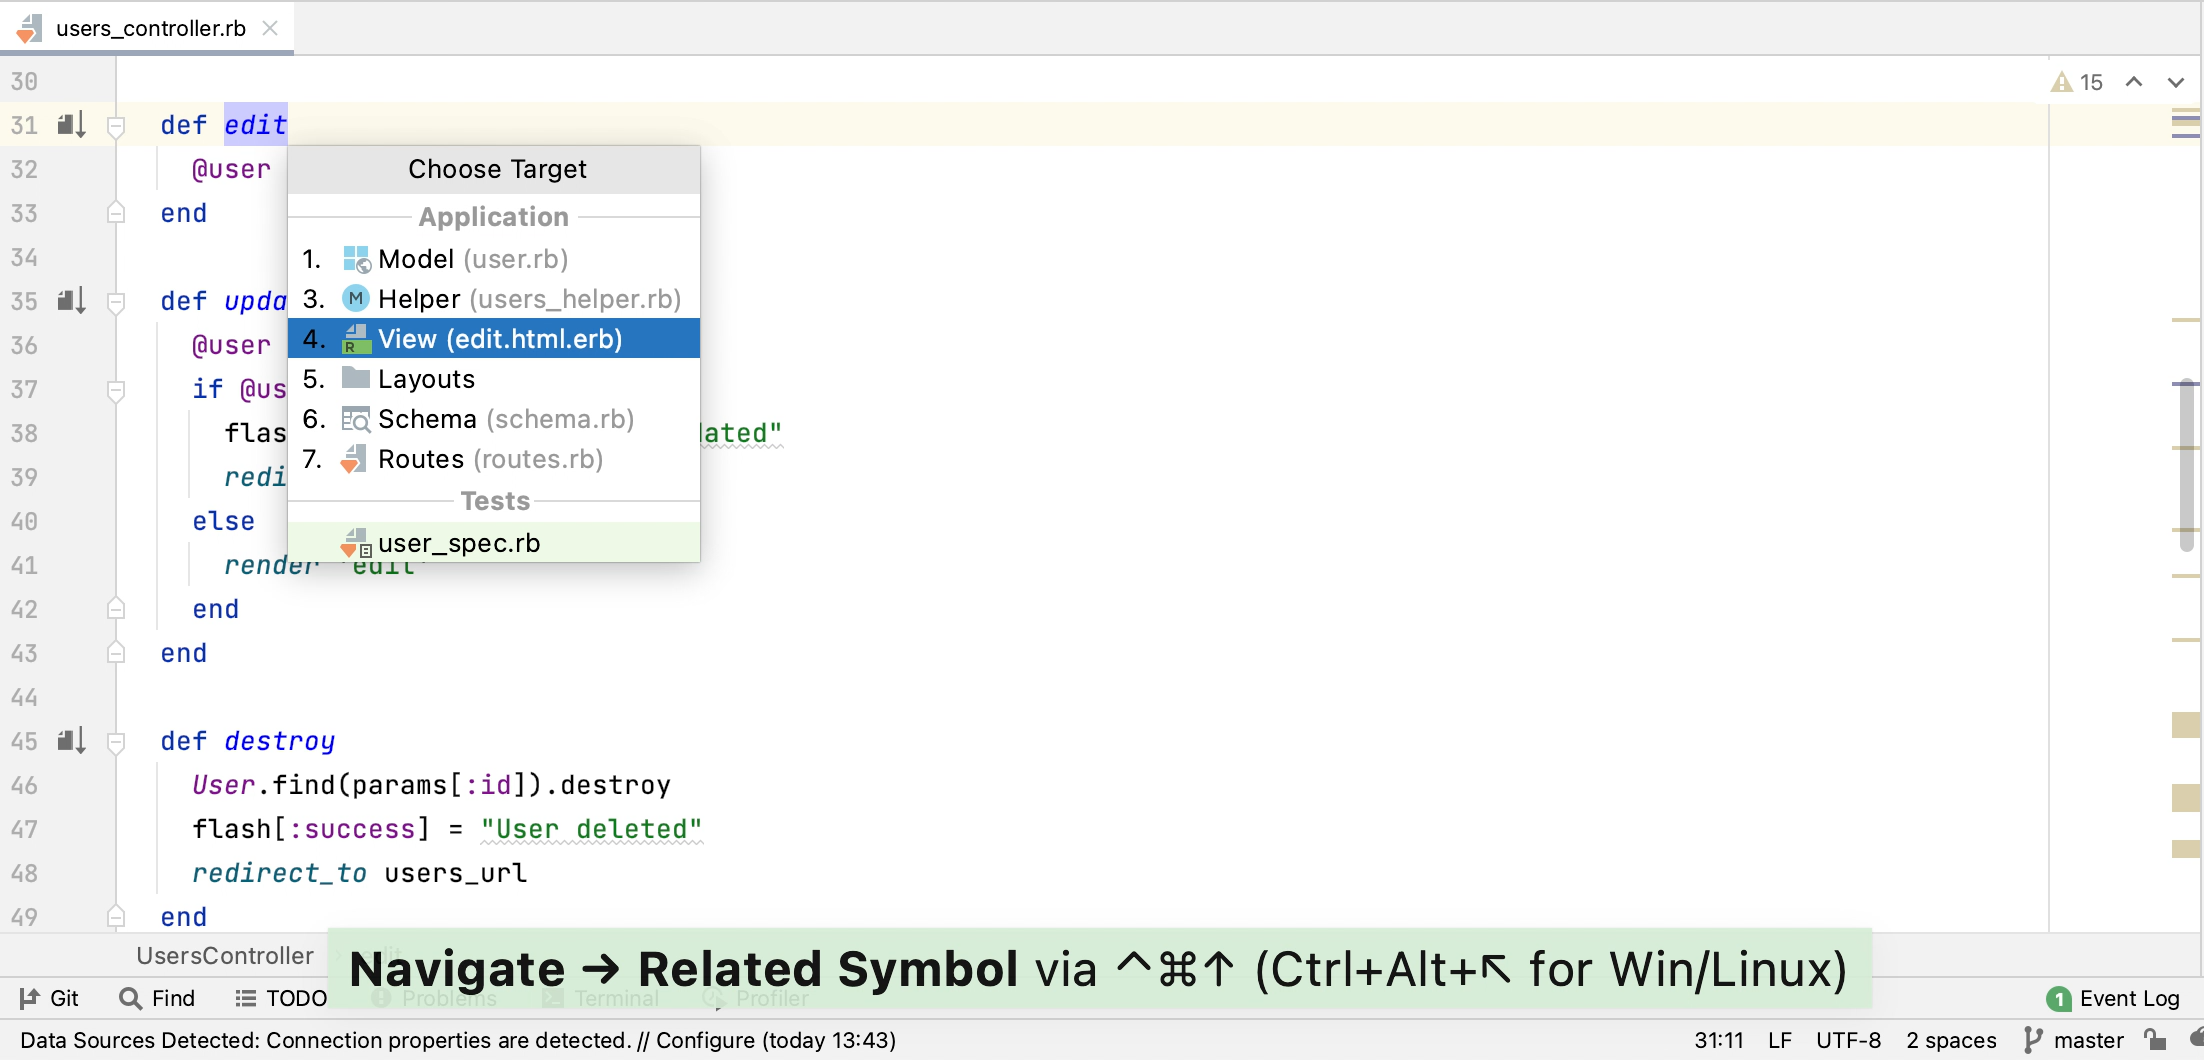
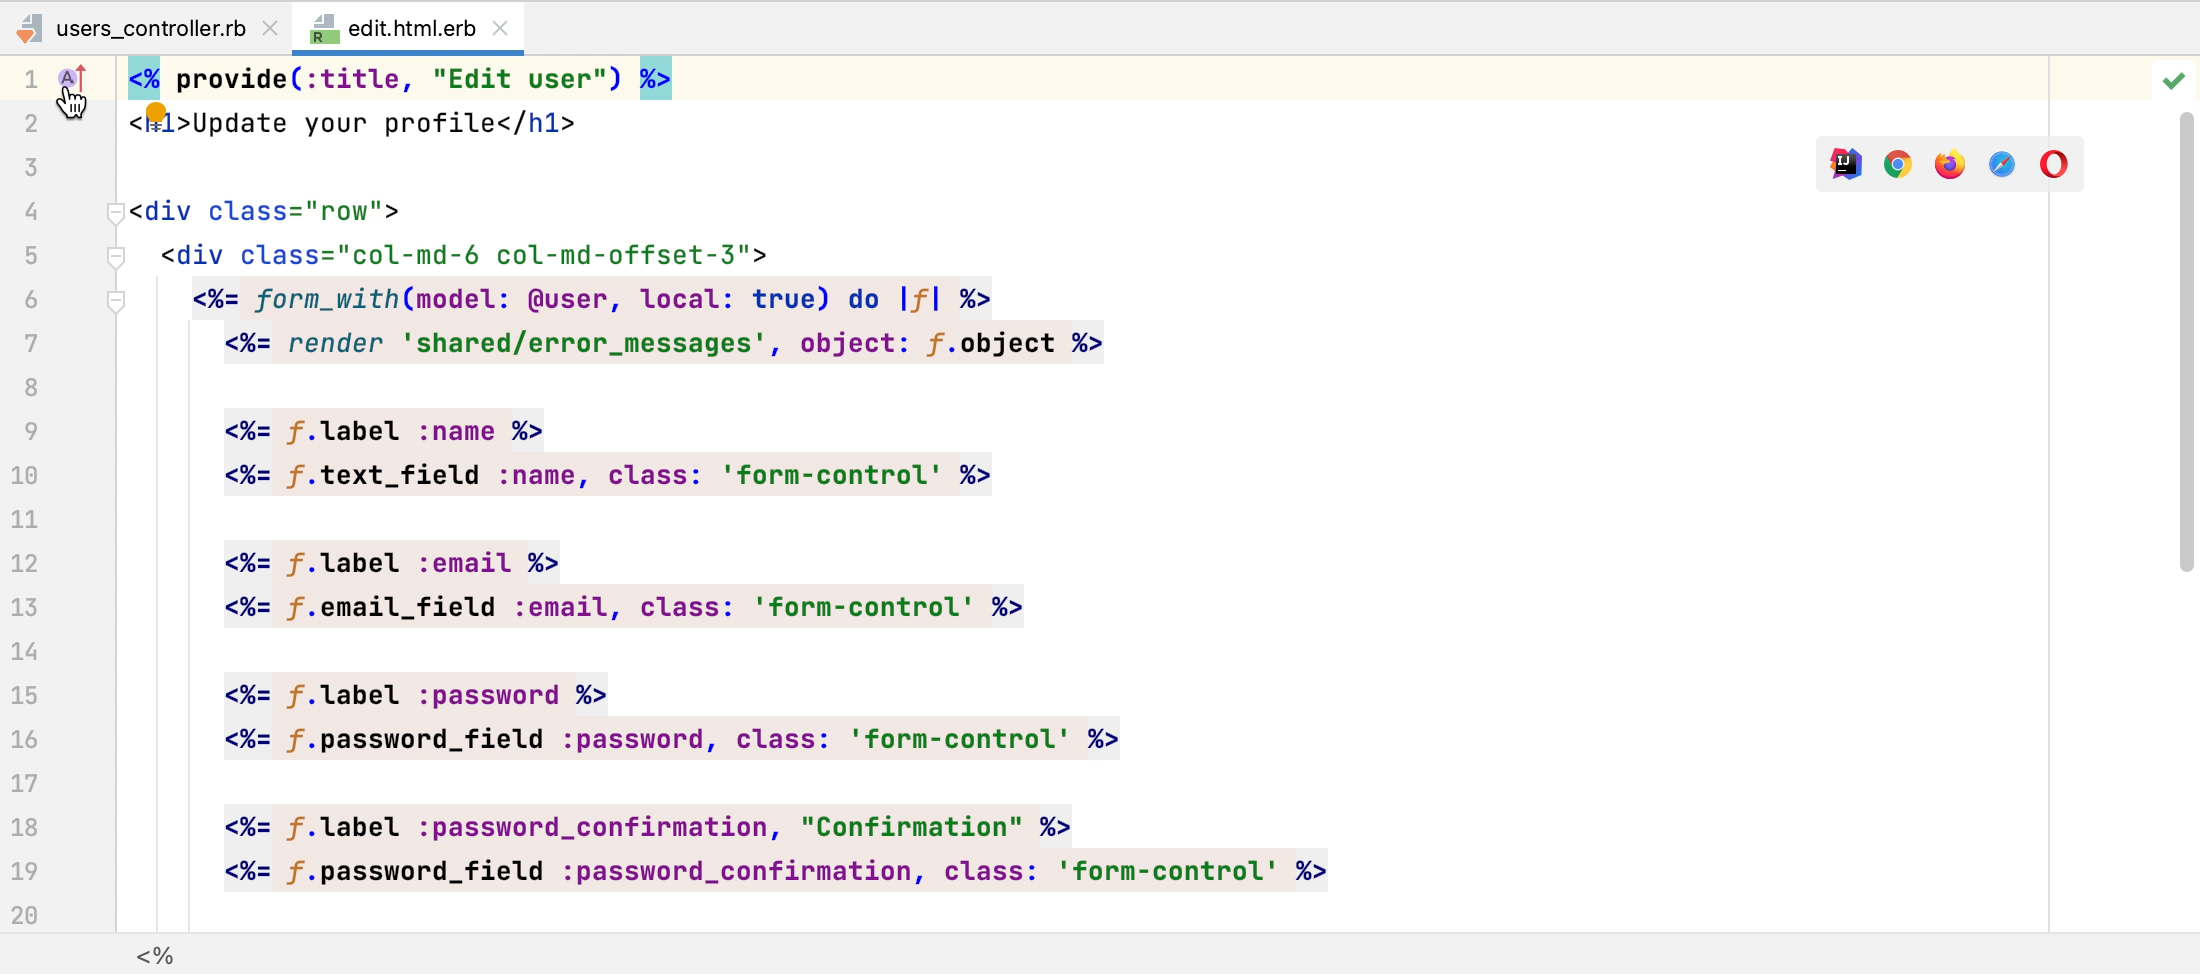
When working on a specific Rails entity, like a controller, you can navigate to the related view, model, test, or helper. Place the caret next to edit method, press Ctrl+Alt+Home, select View and press Enter. IntelliJ IDEA will open the edit.html.erb file containing the corresponding view.
You can use the same shortcut within a view or use the icon in the editor gutter to quickly go to the corresponding action.
Search everywhere
The next IntelliJ IDEA feature allows you to search for files, classes, symbols, or options and jump to the entity you need.
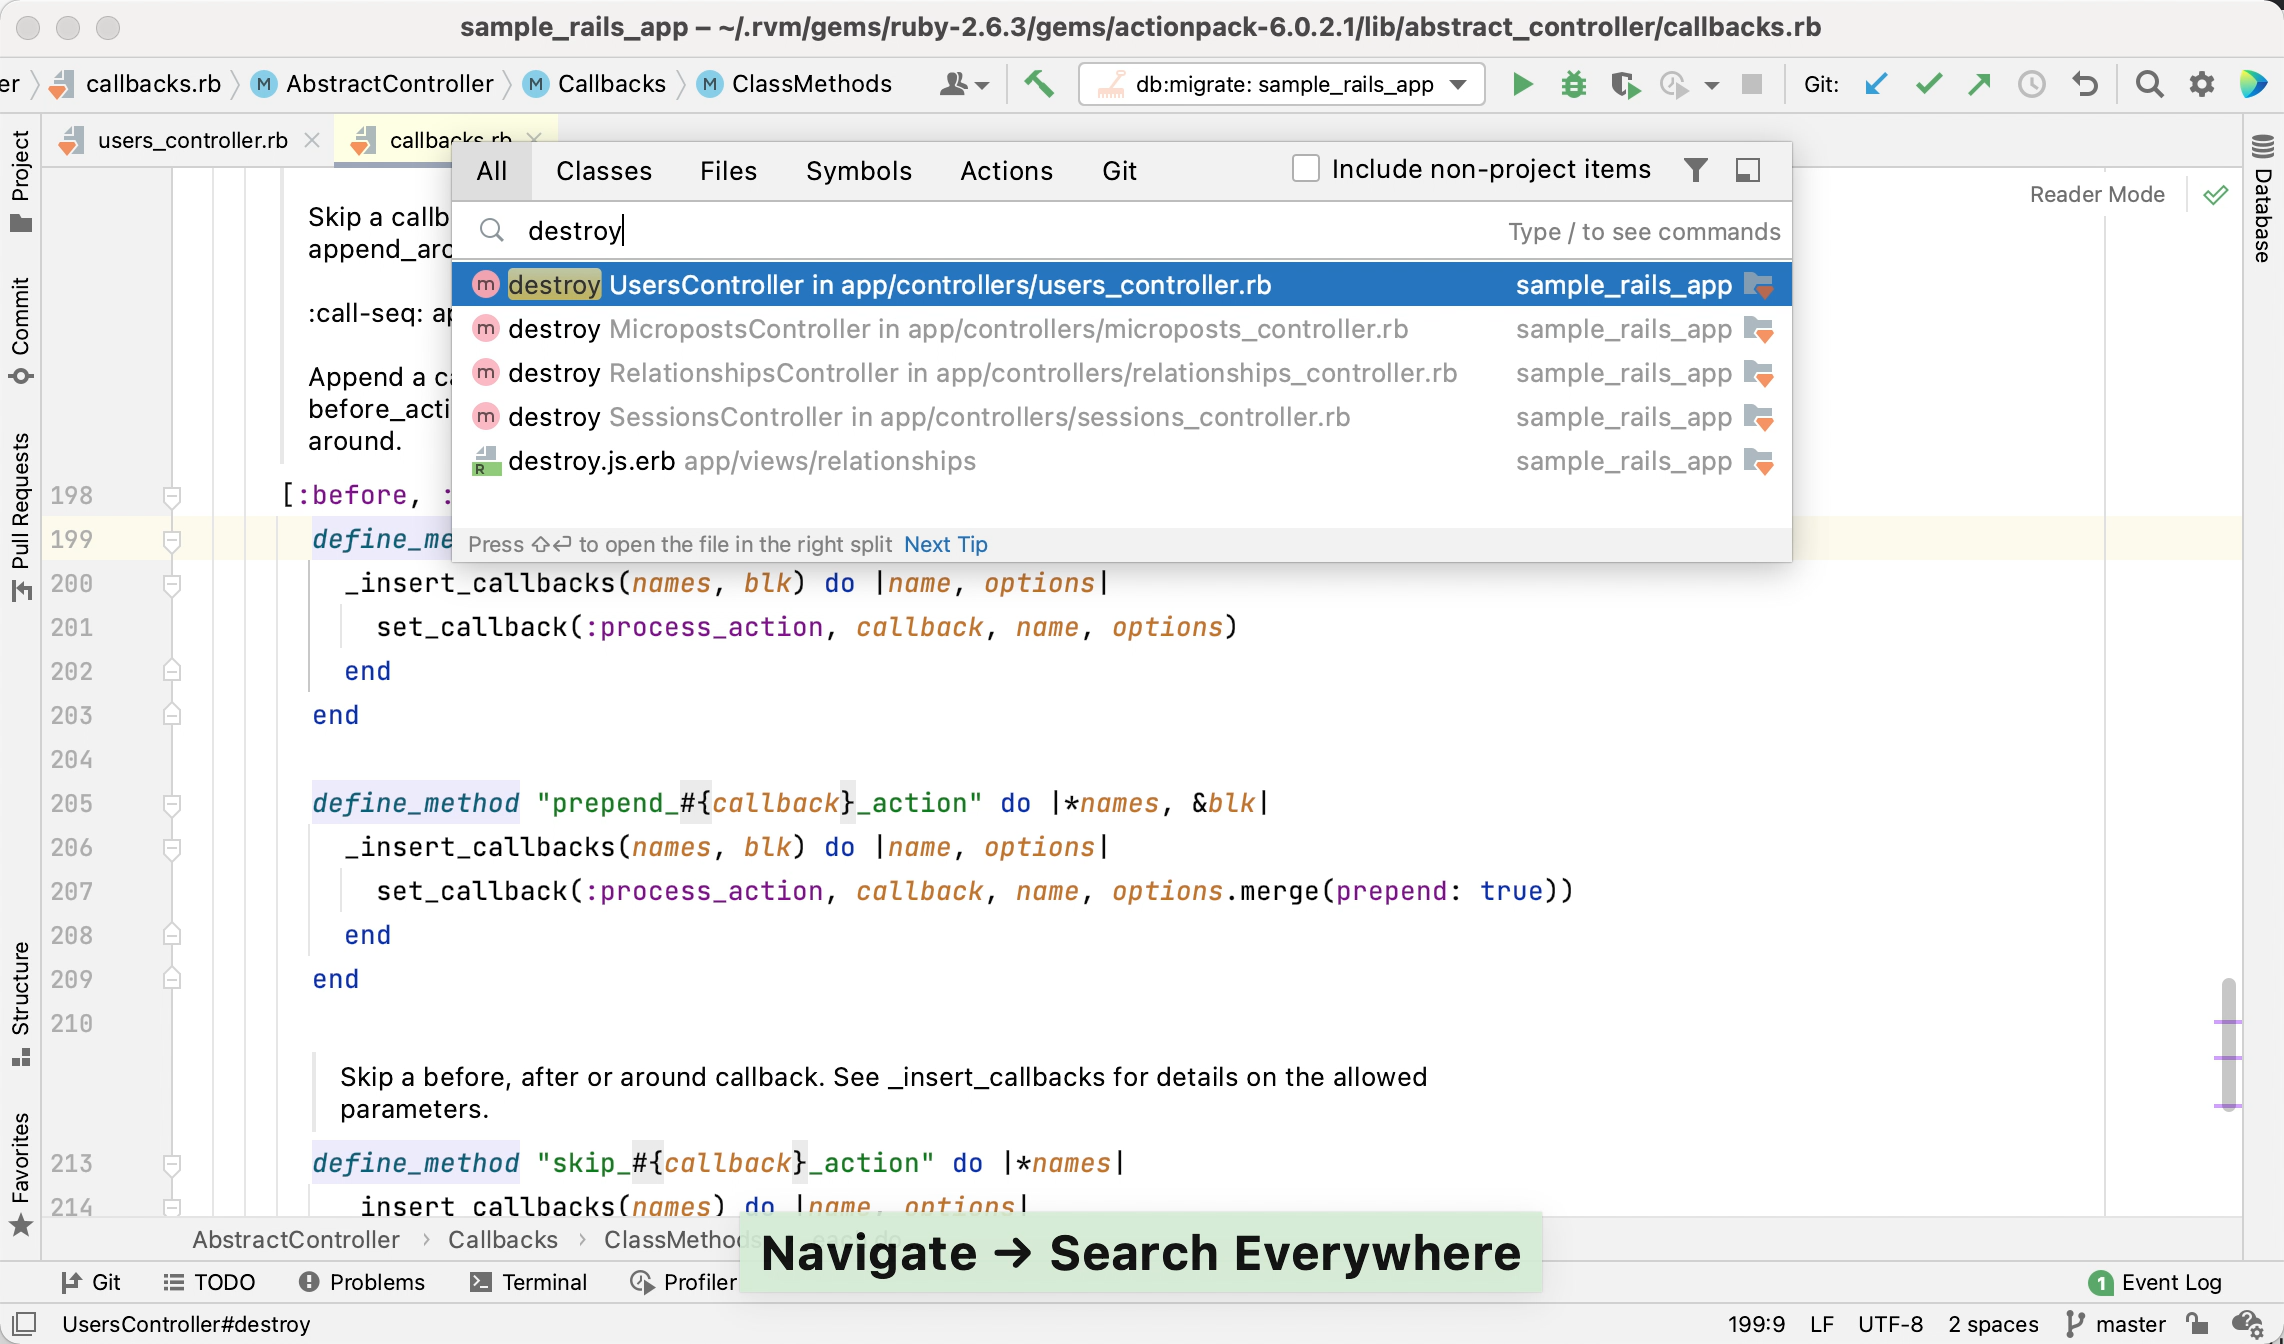
Let’s try to find the destroy action within UsersController. Press Shift twice and start typing destroy. IntelliJ IDEA lists all of the found results where your query is found. Select the destroy action from UsersController and press Enter.

The users_controller.rb file will be opened and the caret will be placed on the definition of the destroy action.
Edit code
IntelliJ IDEA provides multiple code editing features available in the editor that allow you to speed up the development process. These include code completion, refactorings, code inspections, and so on.
Code completion
IntelliJ IDEA can help you complete the names of classes, methods, keywords, and so on. When you invoke code completion, IntelliJ IDEA analyses the context and suggests the choices applicable to the current caret position.
For instance, open the users_controller.rb file and go to the index method declared in the UsersController class. Type the following code inside the method...
... and then type dot. Because the User class is inherited from the ApplicationRecord module, the editor will display all inherited members.
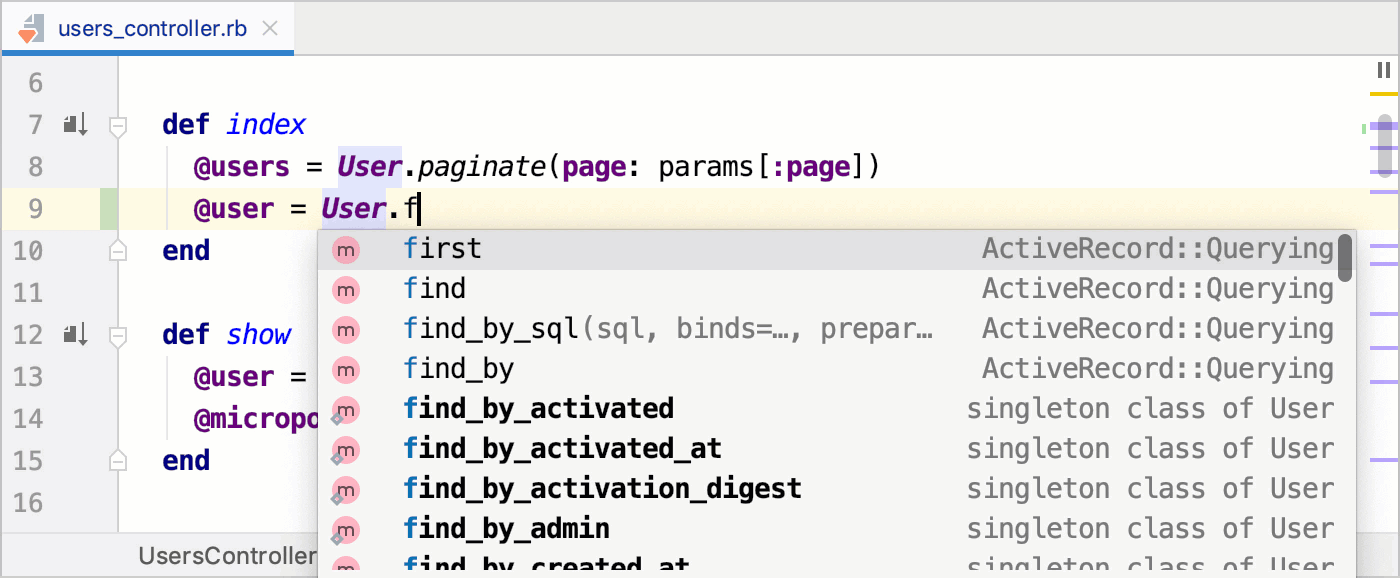
After that, start typing first to filter the list and find the corresponding member from the Querying module, and press Enter.
Intentions
Intentions help you to quickly apply various code changes: convert statements for better code style, add strings to locale dictionaries, use language injections, and so on.
To see intentions in action, open the user.rb file and scroll down to the User.digest method, which uses a multiline ternary operator (?:). According to the Ruby Style Guide, it is preferable to replace such operator with the if/then/else/end block. To do this, place the caret at this ternary expression (for instance, next to ActiveModel) and press Alt+Enter. Press Enter to convert a ternary operator to the if/then/else/end block.
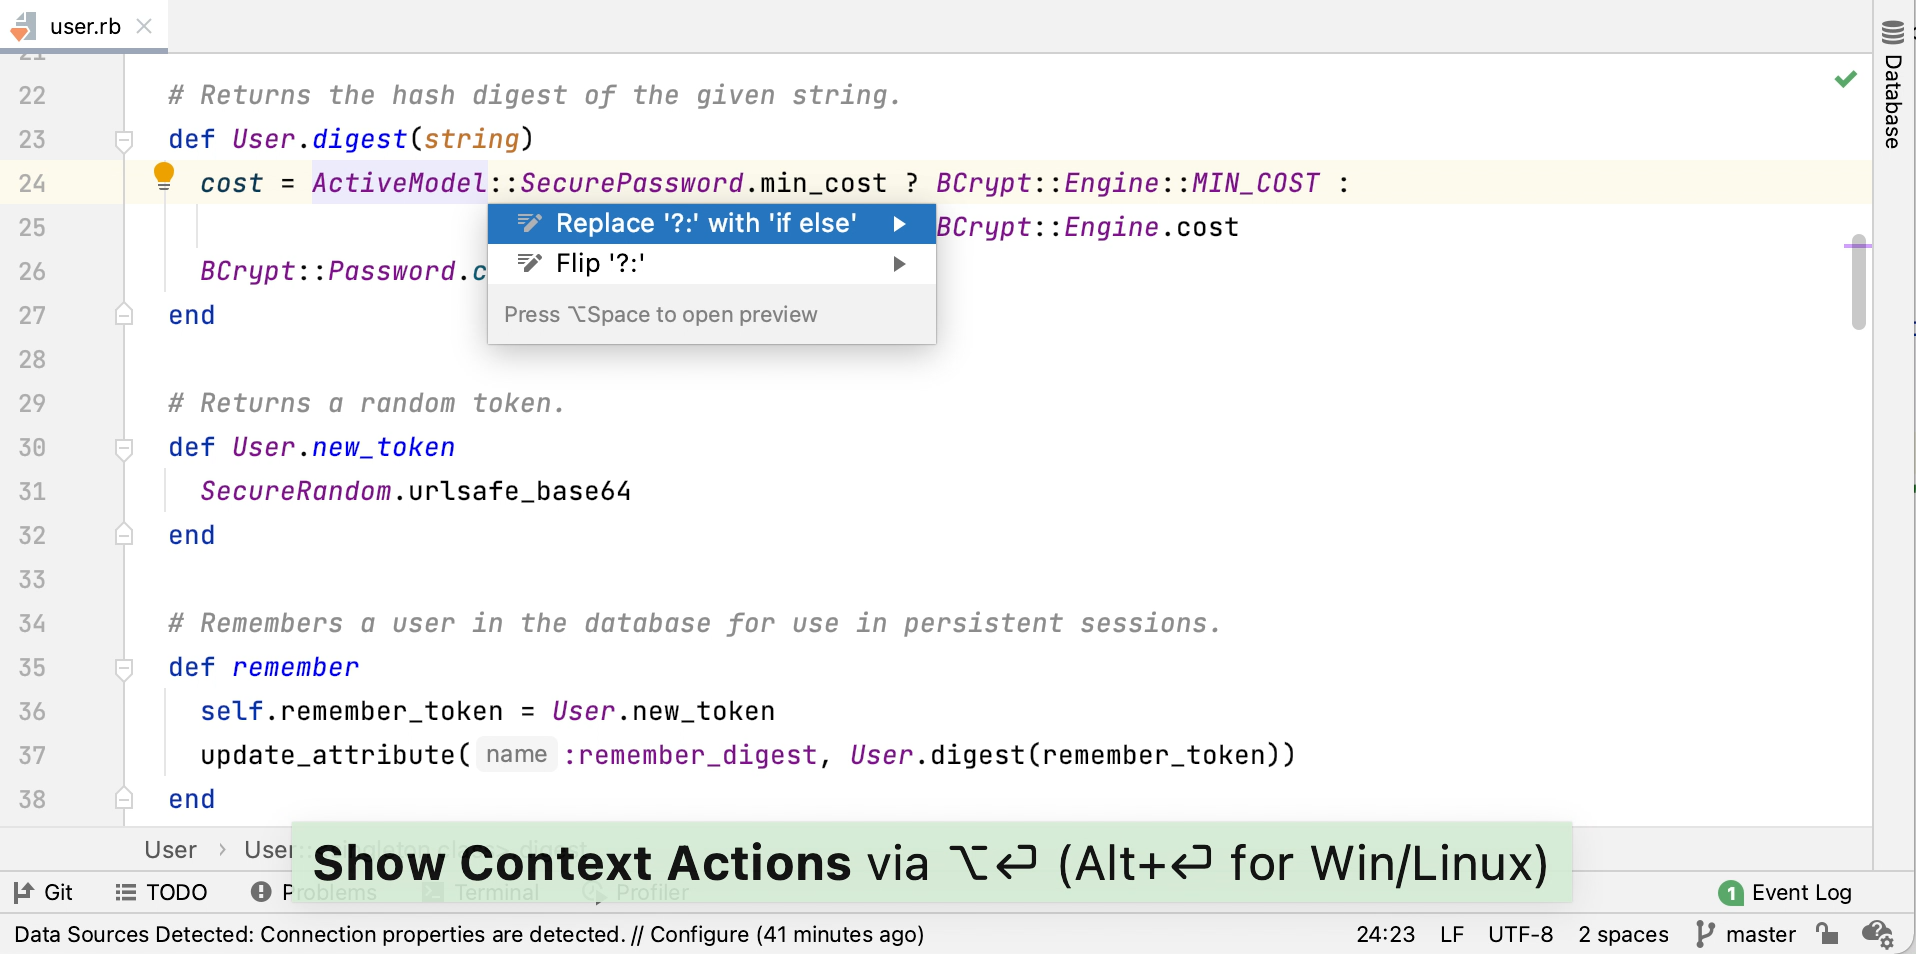
Note that you can check your code and detect possible issues using inspections.
Refactor code
Refactoring is the process of modifying source code in order to make it easier to maintain and extend, but without changing its behavior. Let’s look at some refactoring features available in IntelliJ IDEA.
Rename refactorings allow you to rename classes, methods, files, variables, and parameters with all the references to them in the code corrected accordingly. Open the users.rb file and scroll down to the downcase_email method raised in the before_save ActiveRecord callback. Place the caret next to this method and press Ctrl+Shift+I to see its definition.
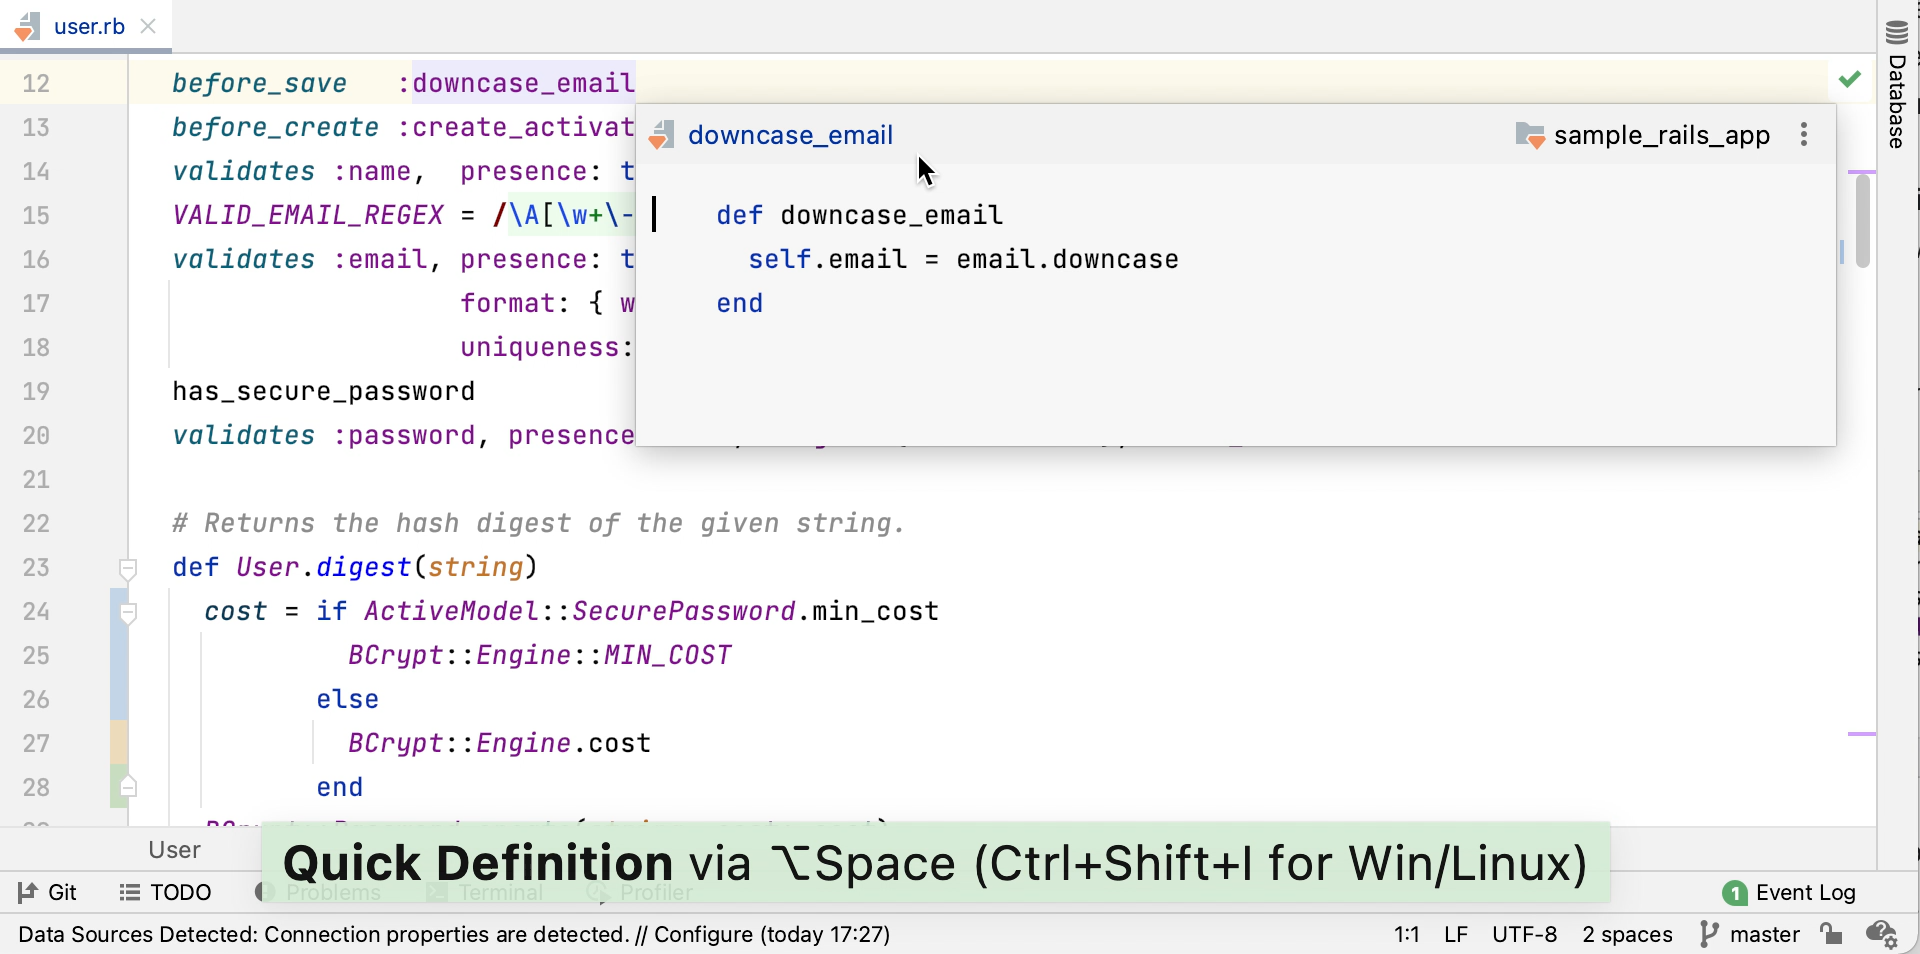
Click Esc and press Ctrl+Alt+Shift+T. Select Rename in the invoked popup, which suggests various refactorings.
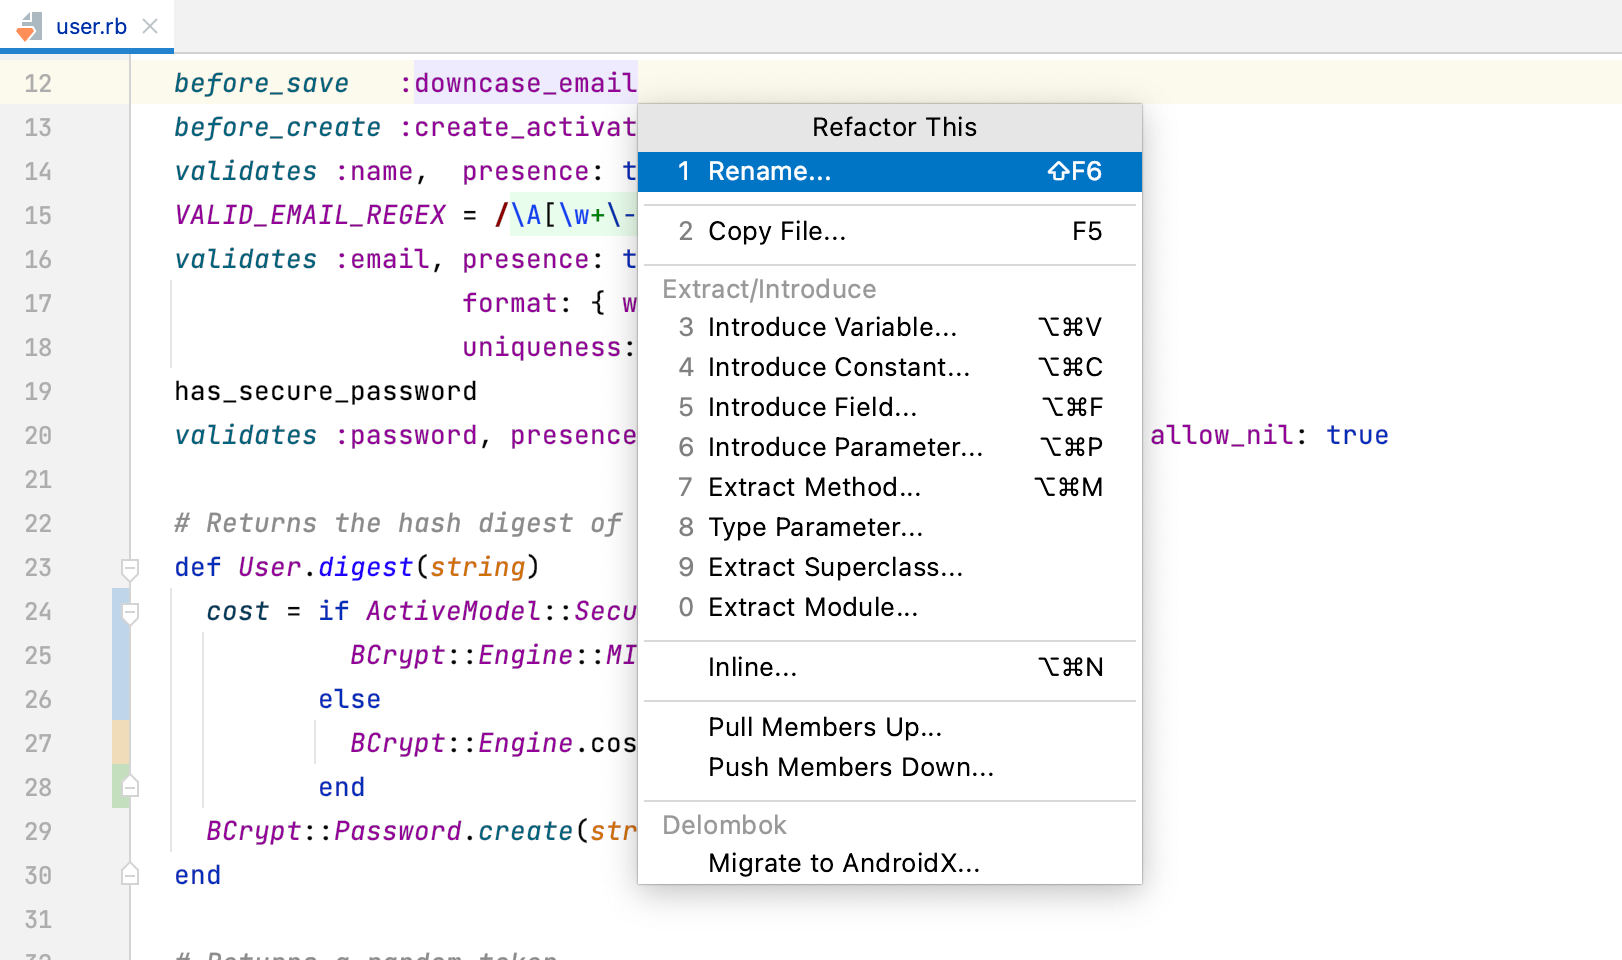
In the Rename dialog, specify a new method name (lowercase_email in our case) and click Refactor.

The Refactor Preview window will display all references to the renamed method.

Click Do Refactor to rename the method in all places.
Extract variable
The Extract Variable refactoring puts the result of the selected expression into a variable. It declares a new variable and uses the expression as an initializer. The original expression is replaced with the new variable.
Open the user.rb file and go to the feed method. In this method, we can extract an SQL subquery to a variable. To do this, select a corresponding substring and press Ctrl+Alt+V. Then, specify the variable name and press Enter to finish extracting.

Reformat code
IntelliJ IDEA allows you to reformat source code to meet the requirements of your code style.
Let's reformat the code of the user.rb file. Open this file and press Ctrl+Alt+L.
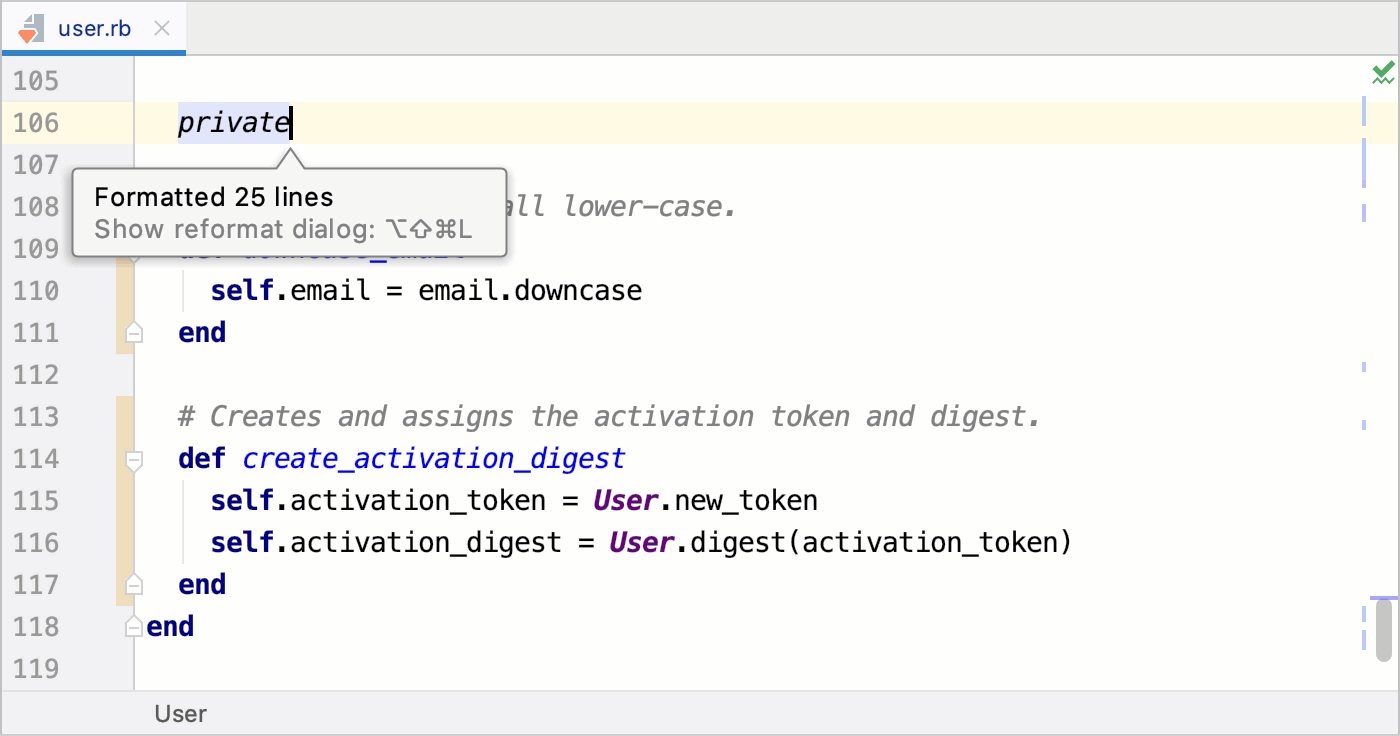
IntelliJ IDEA will reformat the entire file and display a number of changed lines.
Analyze code
In this part, we’ll perform static code analysis and detect problems.
IntelliJ IDEA supports multiple inspection types and, moreover, allows displaying RuboCop offenses inside the IDE. The RuboCop inspection is enabled in IntelliJ IDEA by default and requires the RuboCop gem to be installed in the module SDK. If this gem not installed, IntelliJ IDEA will suggest doing this.

Let’s open the Gemfile containing a list of gems used by the application. Hover the mouse pointer over the warning displayed for the active gem.
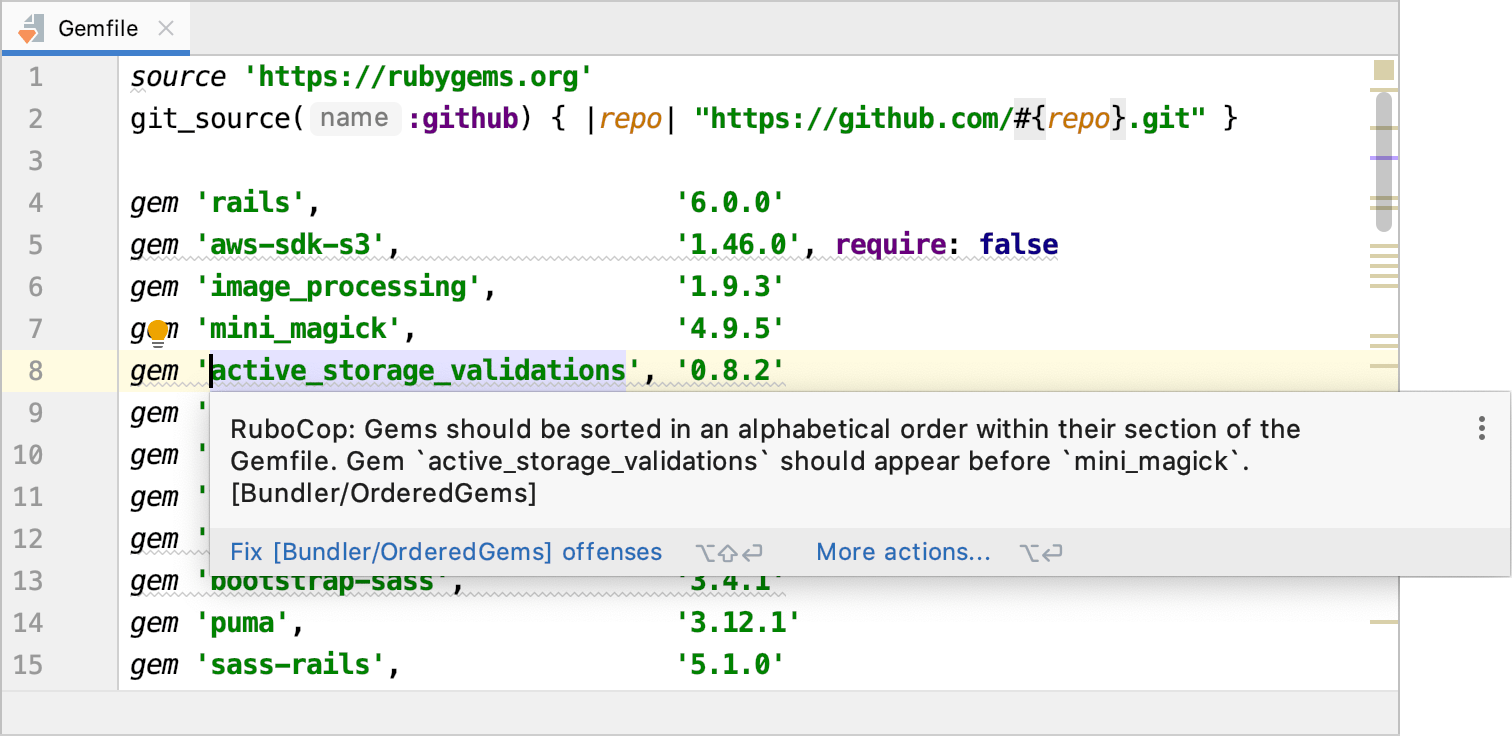
IntelliJ IDEA will display a Rubocop message that notifies you about necessity to order gems in the alphabetical order (see OrderedGems).
Place the caret next to the active_storage_validations gem and press Alt+Enter. The editor will suggest fixing all issues related to incorrect gems ordering. Press Enter to do this.
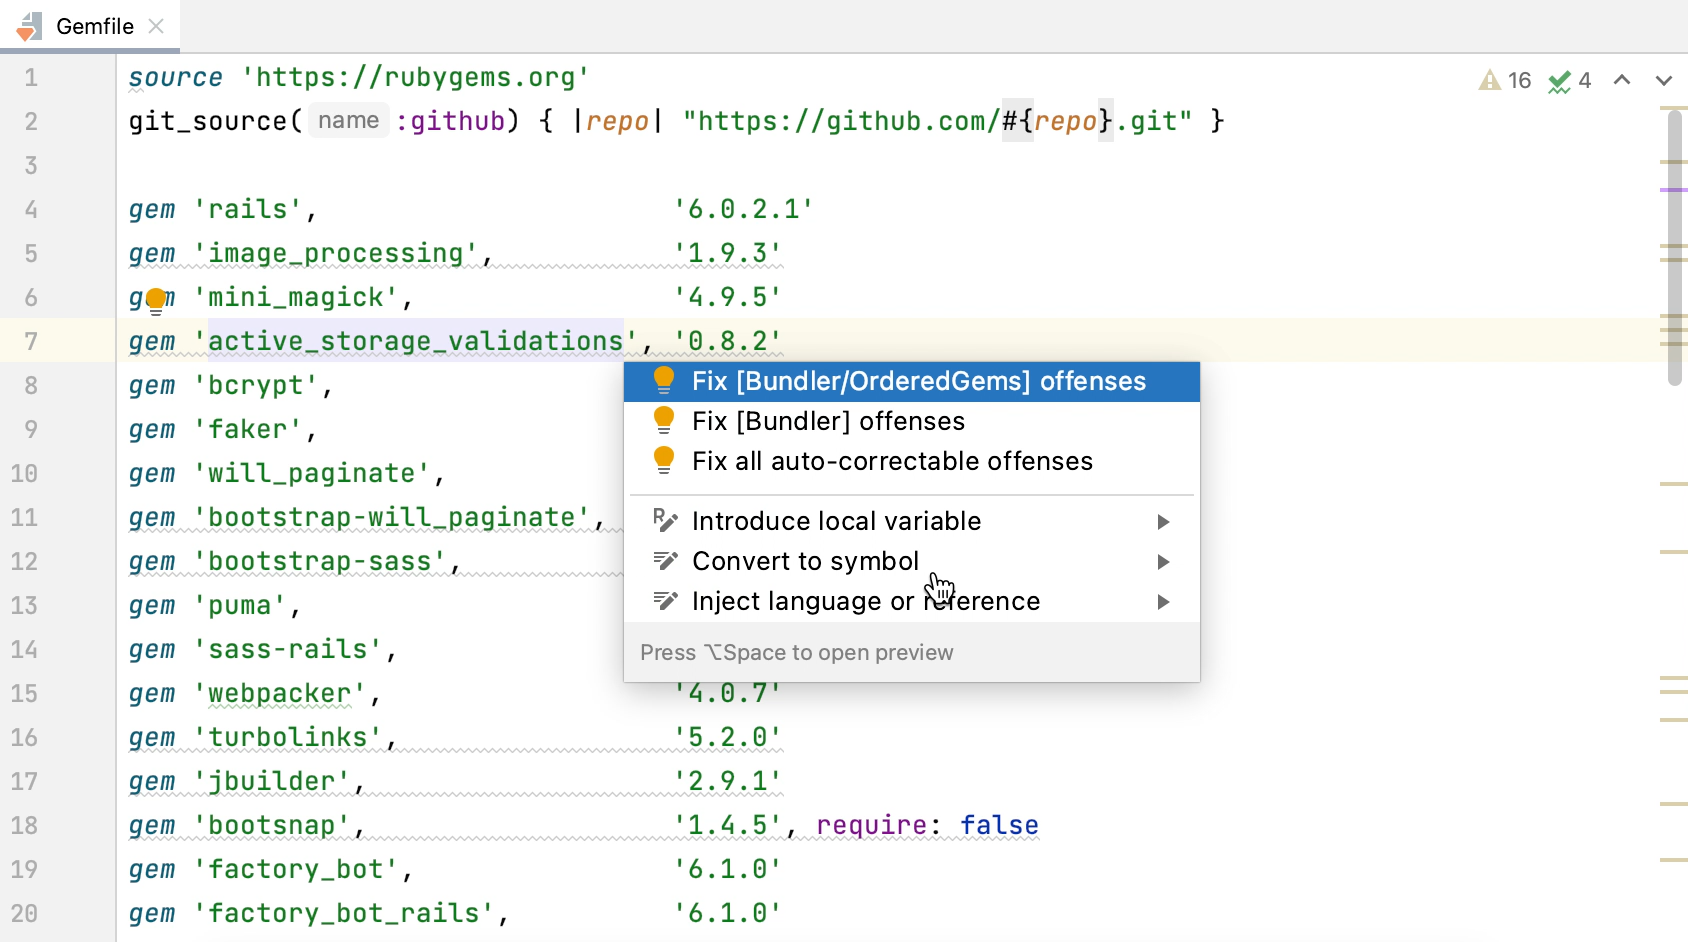
You can also check the entire project and display all warnings in a single report. To do this, select in the main menu. In the invoked dialog, you can specify the desired inspection scope.
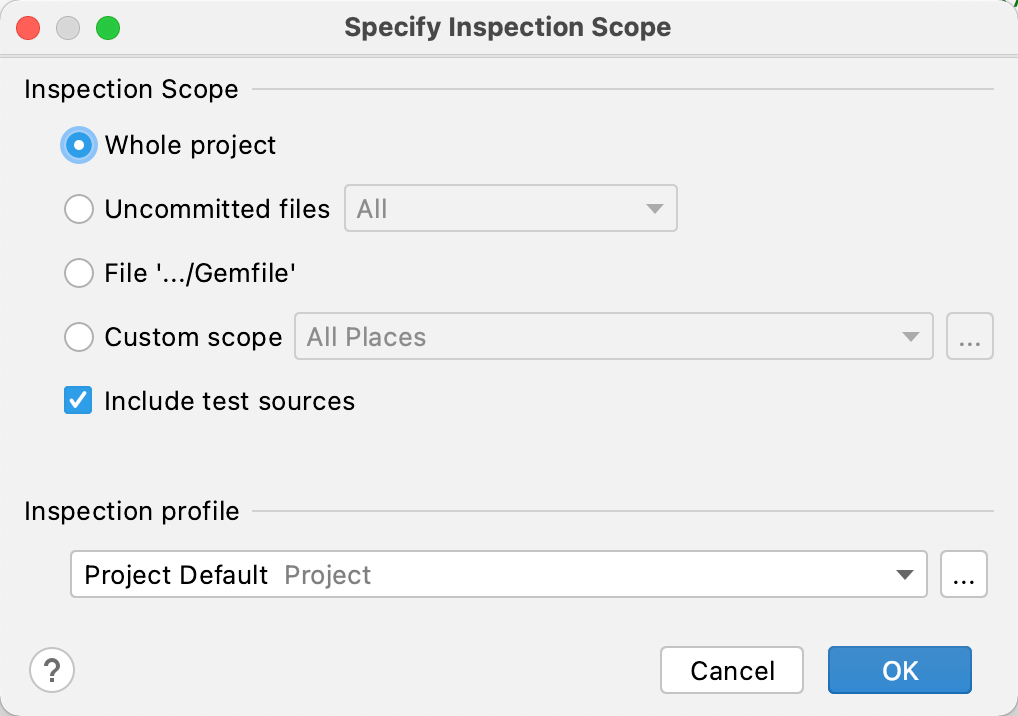
Leave the Whole project option and click OK. The inspection results window will show warnings for a whole project.
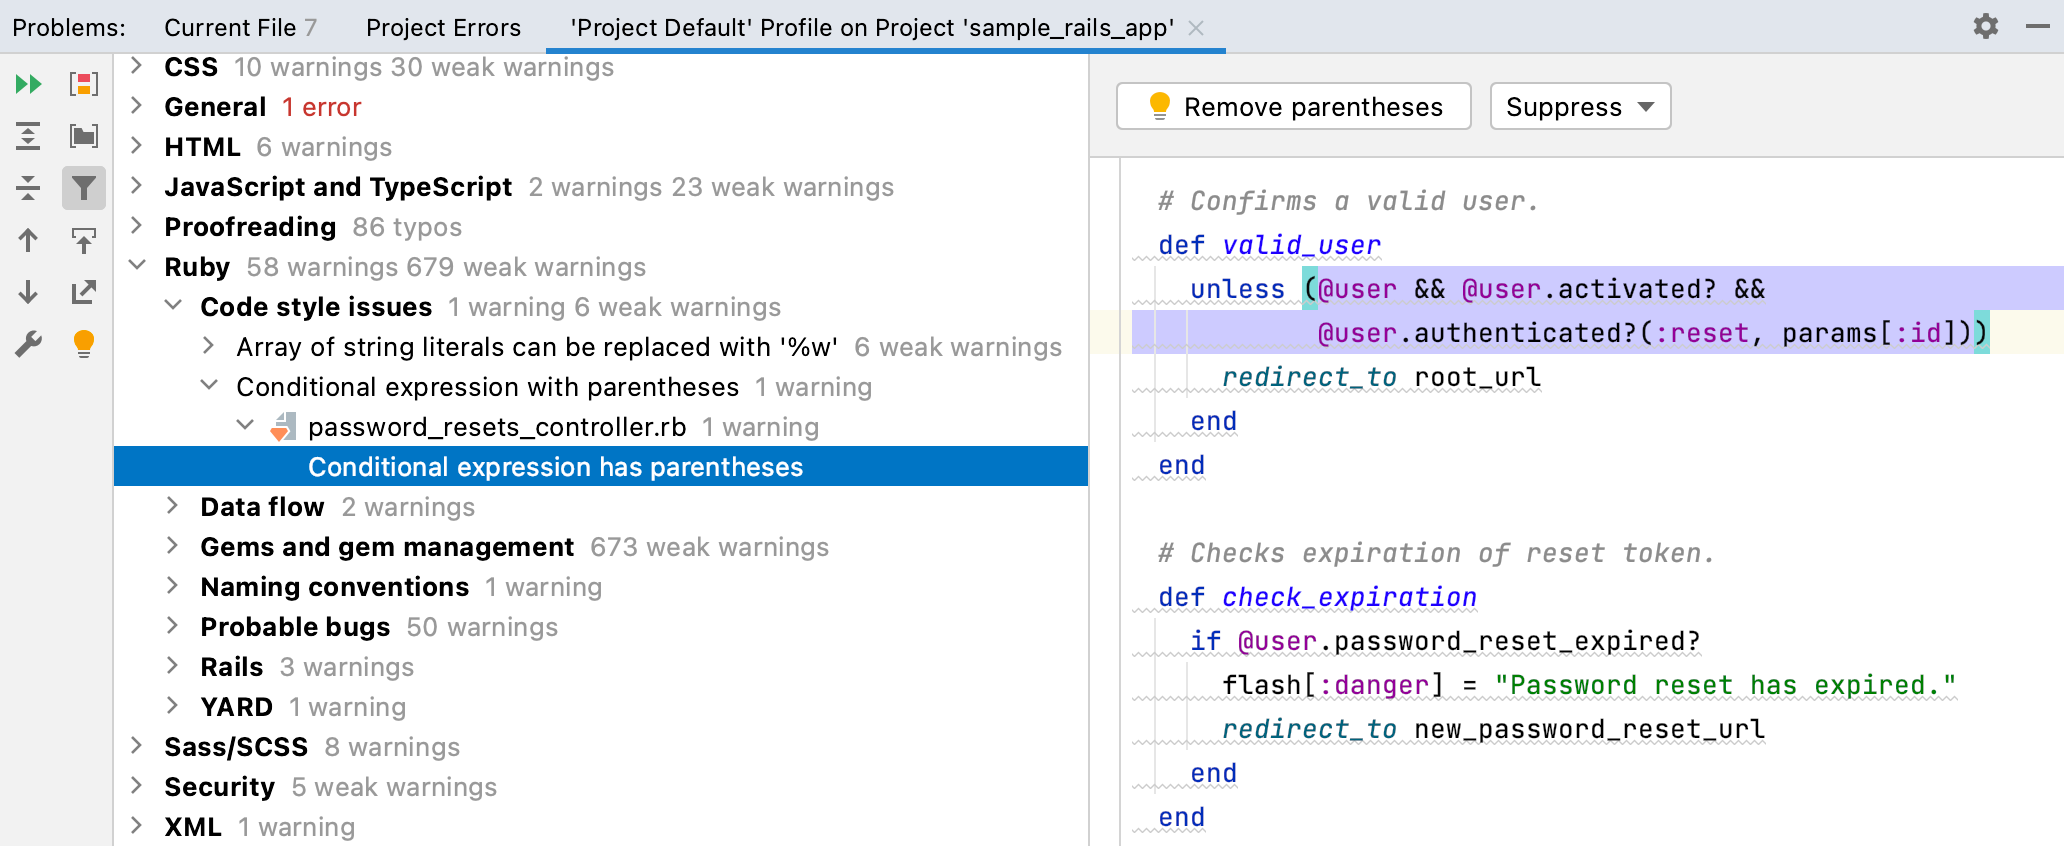
You can navigate through this report and fix or suppress specific warnings.
Run tests
IntelliJ IDEA enables you to use different testing frameworks such as Minitest, RSpec or Cucumber.
Run all tests
Our project contains Minitest tests in the test folder. To run all tests, open the Project view by pressing Alt+1. Then, right-click the test folder and select from the context menu.
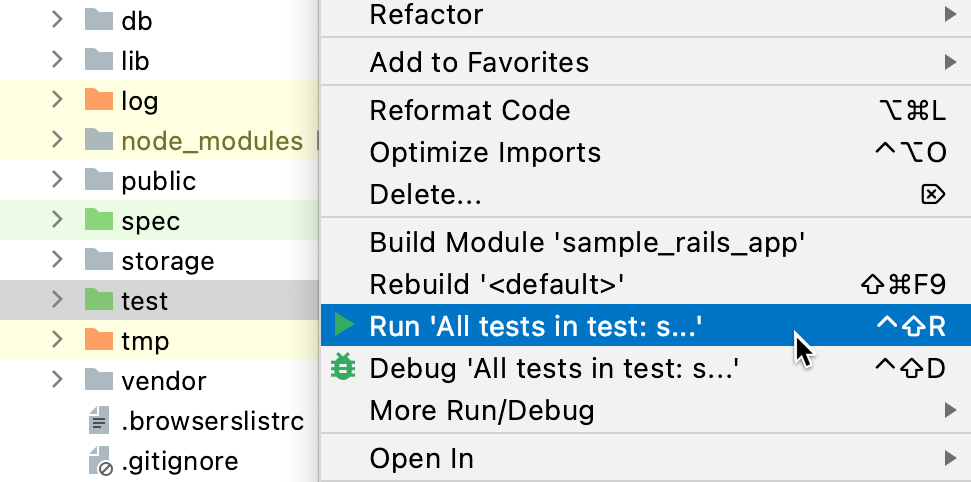
IntelliJ IDEA will run and display test results in the Run tool window.
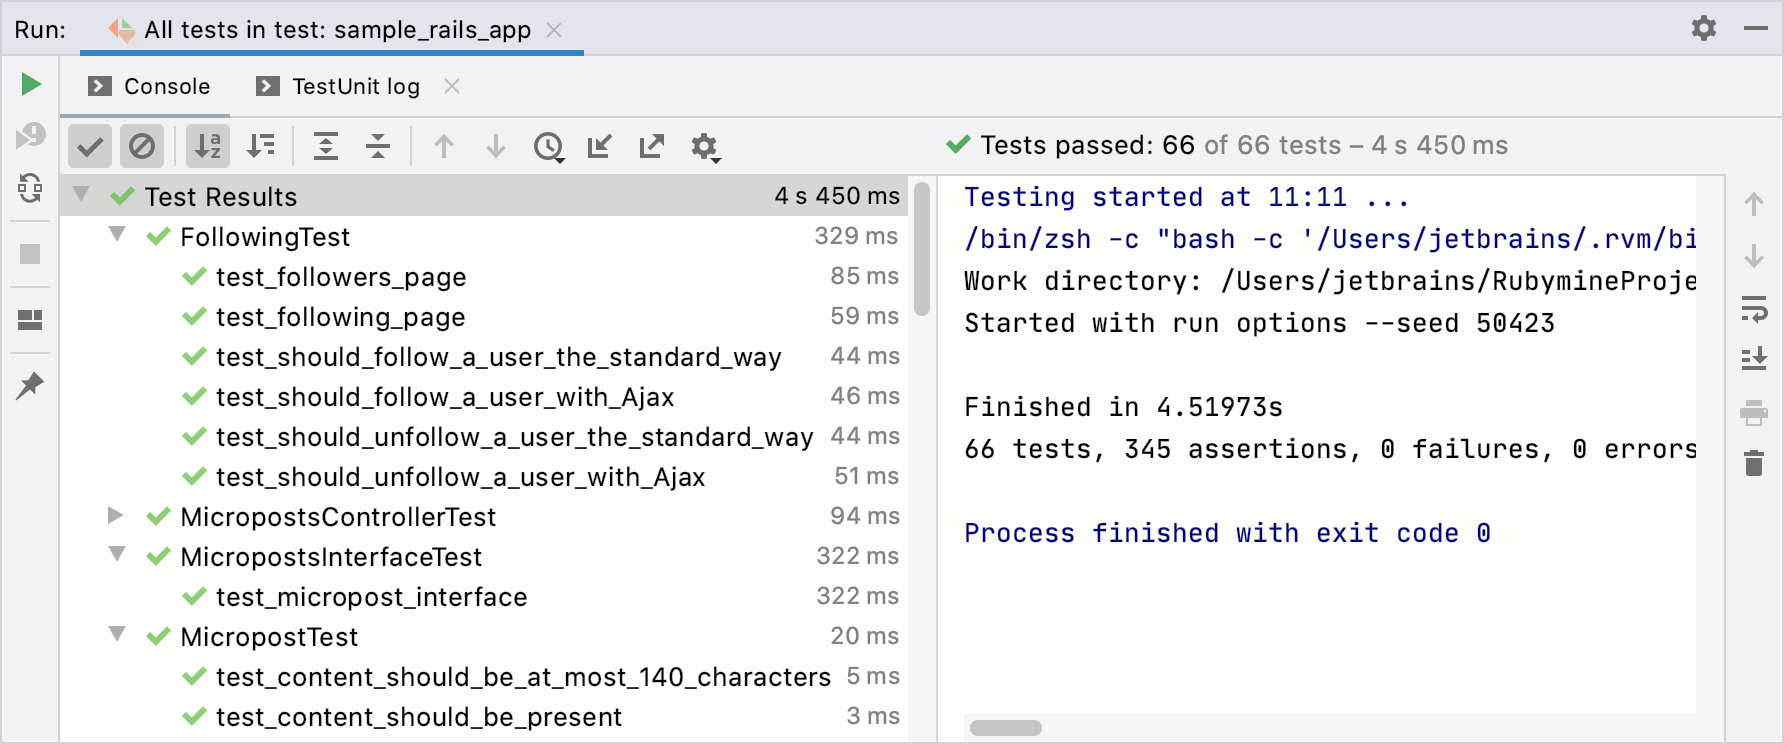
Run specific tests
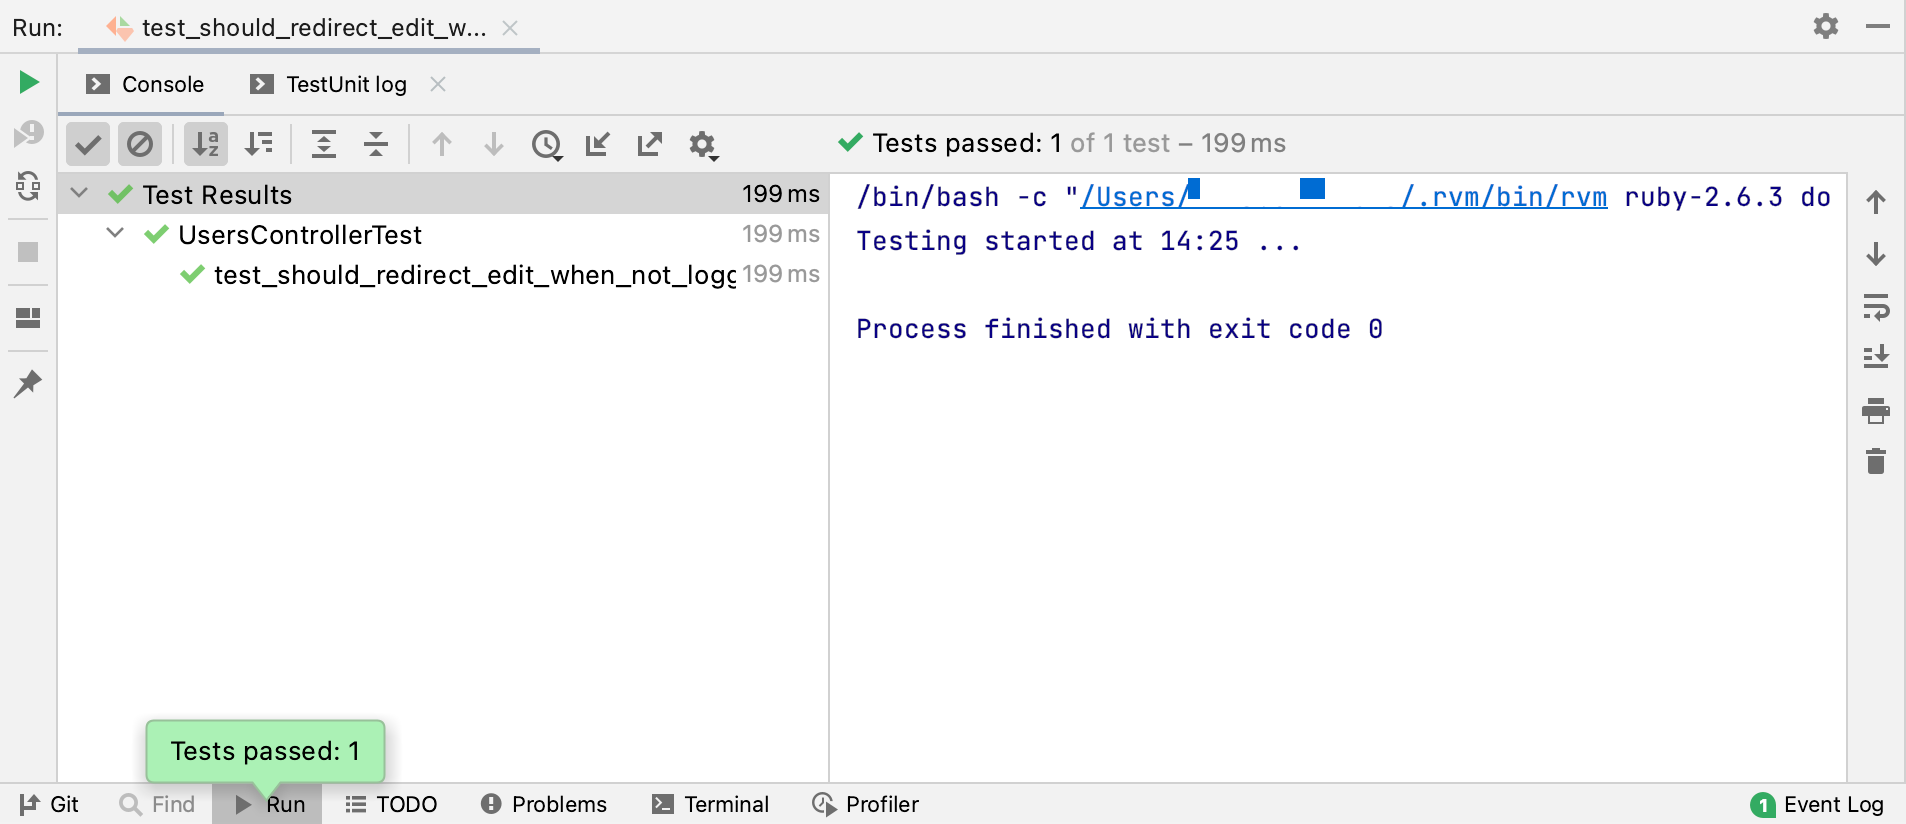
Now let’s see how to run a specific test. Open the users_controller_test.rb file, scroll down to the should redirect index when not logged in test and click the Run button on the left gutter next to this test.
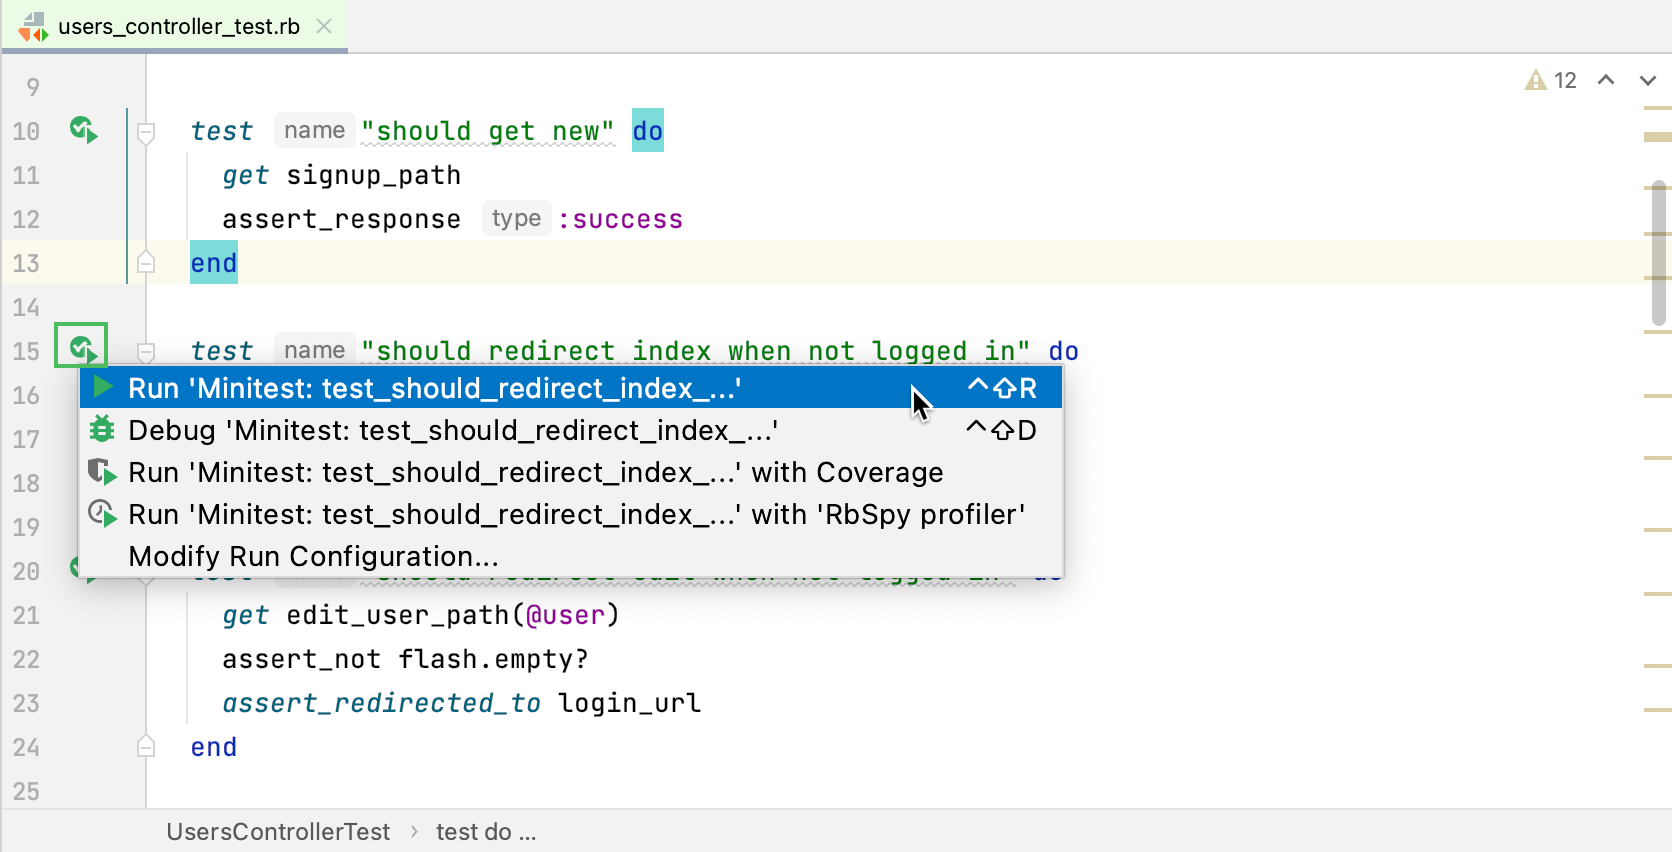
In the invoked menu, select Run ‘Minitest: test_should_redirect_index...’. IntelliJ IDEA will display the result for this test.
Rerun failed tests
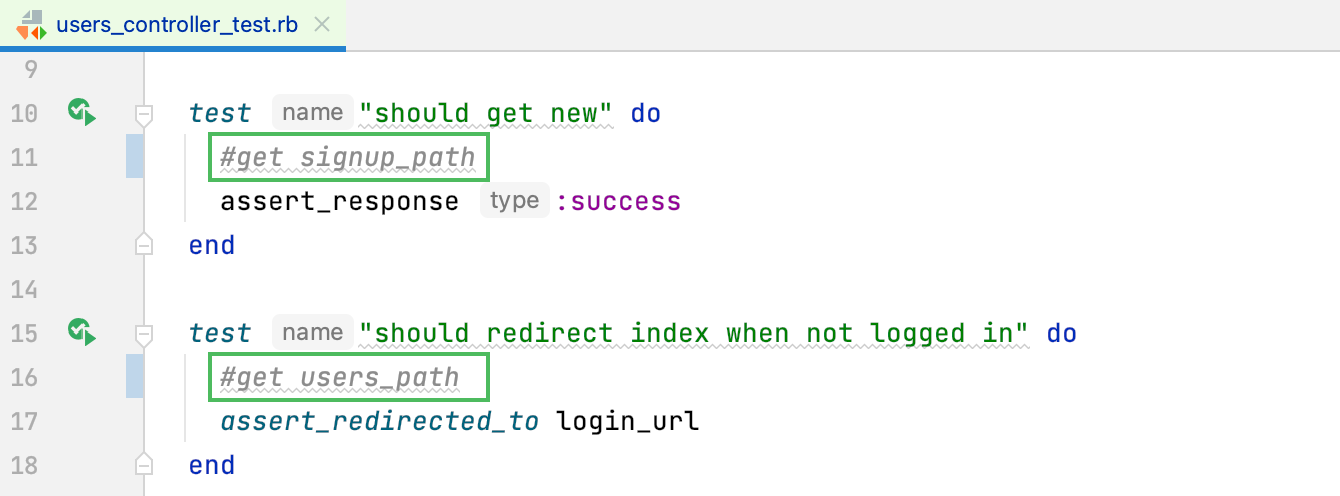
Now let’s go back to users_controller_test.rb and break two tests. For the should get new and should redirect index when not logged in tests comment the get_sighup_path and get users_path lines. To do this, select these lines and use the Ctrl+/ shortcut.
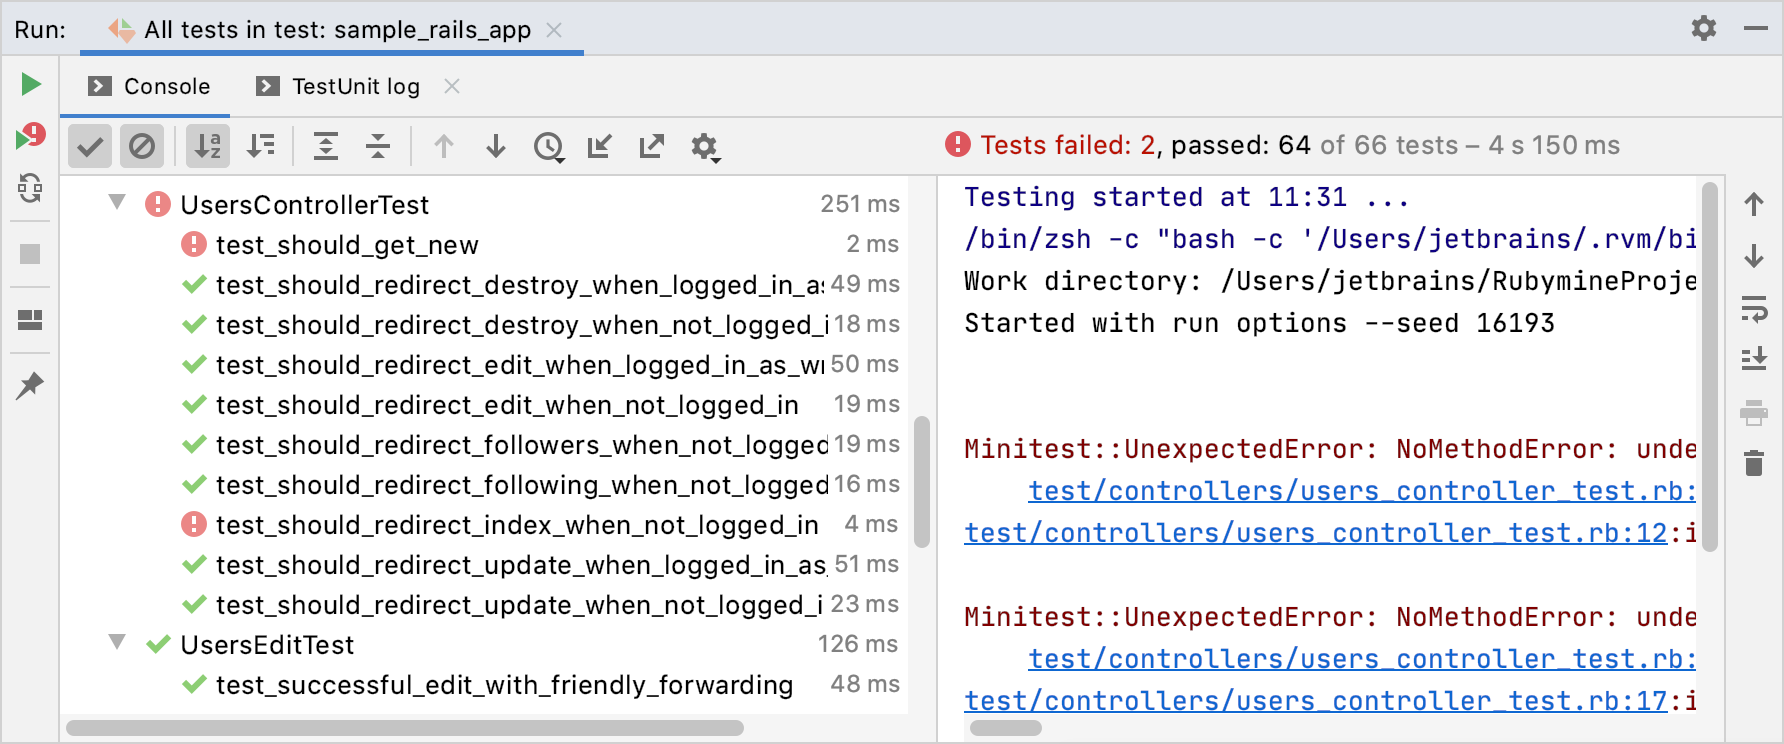
Run all tests again as described in Run all tests. You can see now that these tests failed.
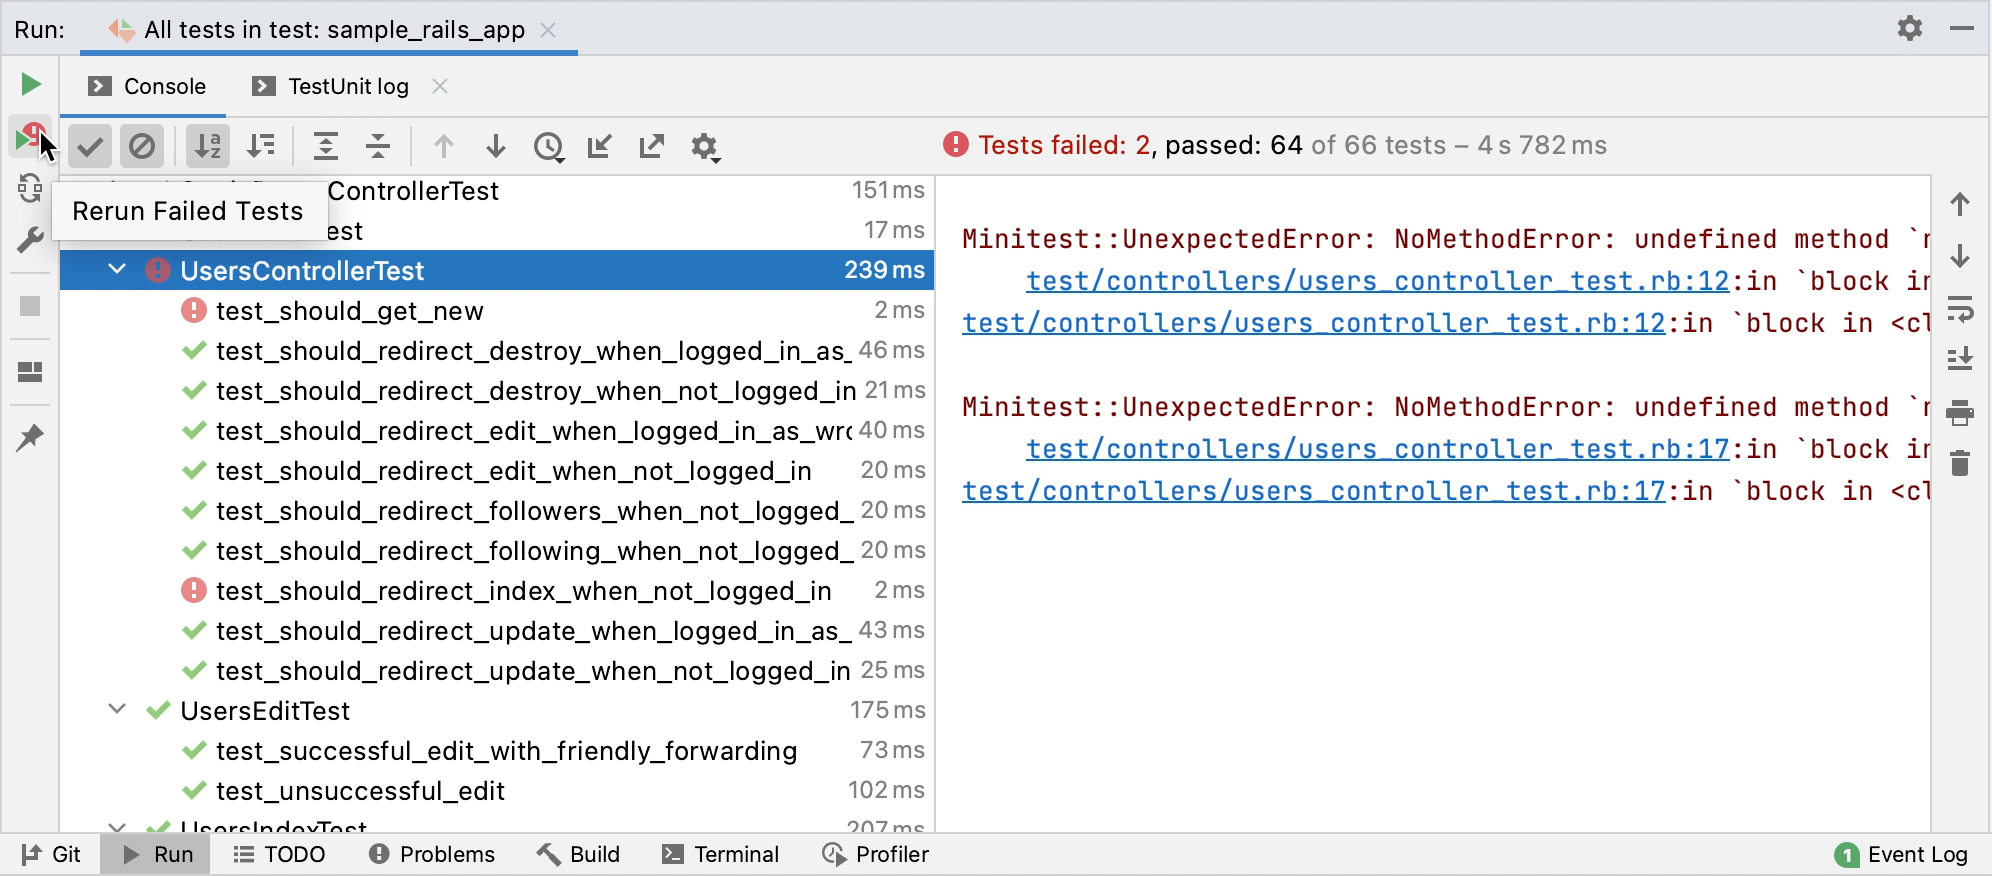
Let’s fix these tests in the currently opened users_controller_test.rb file by uncommenting the get_sighup_path and get users_path lines Ctrl+/. We can now rerun only these failed tests using the button.
Now we are ready to run our application.
Create a run/debug configuration
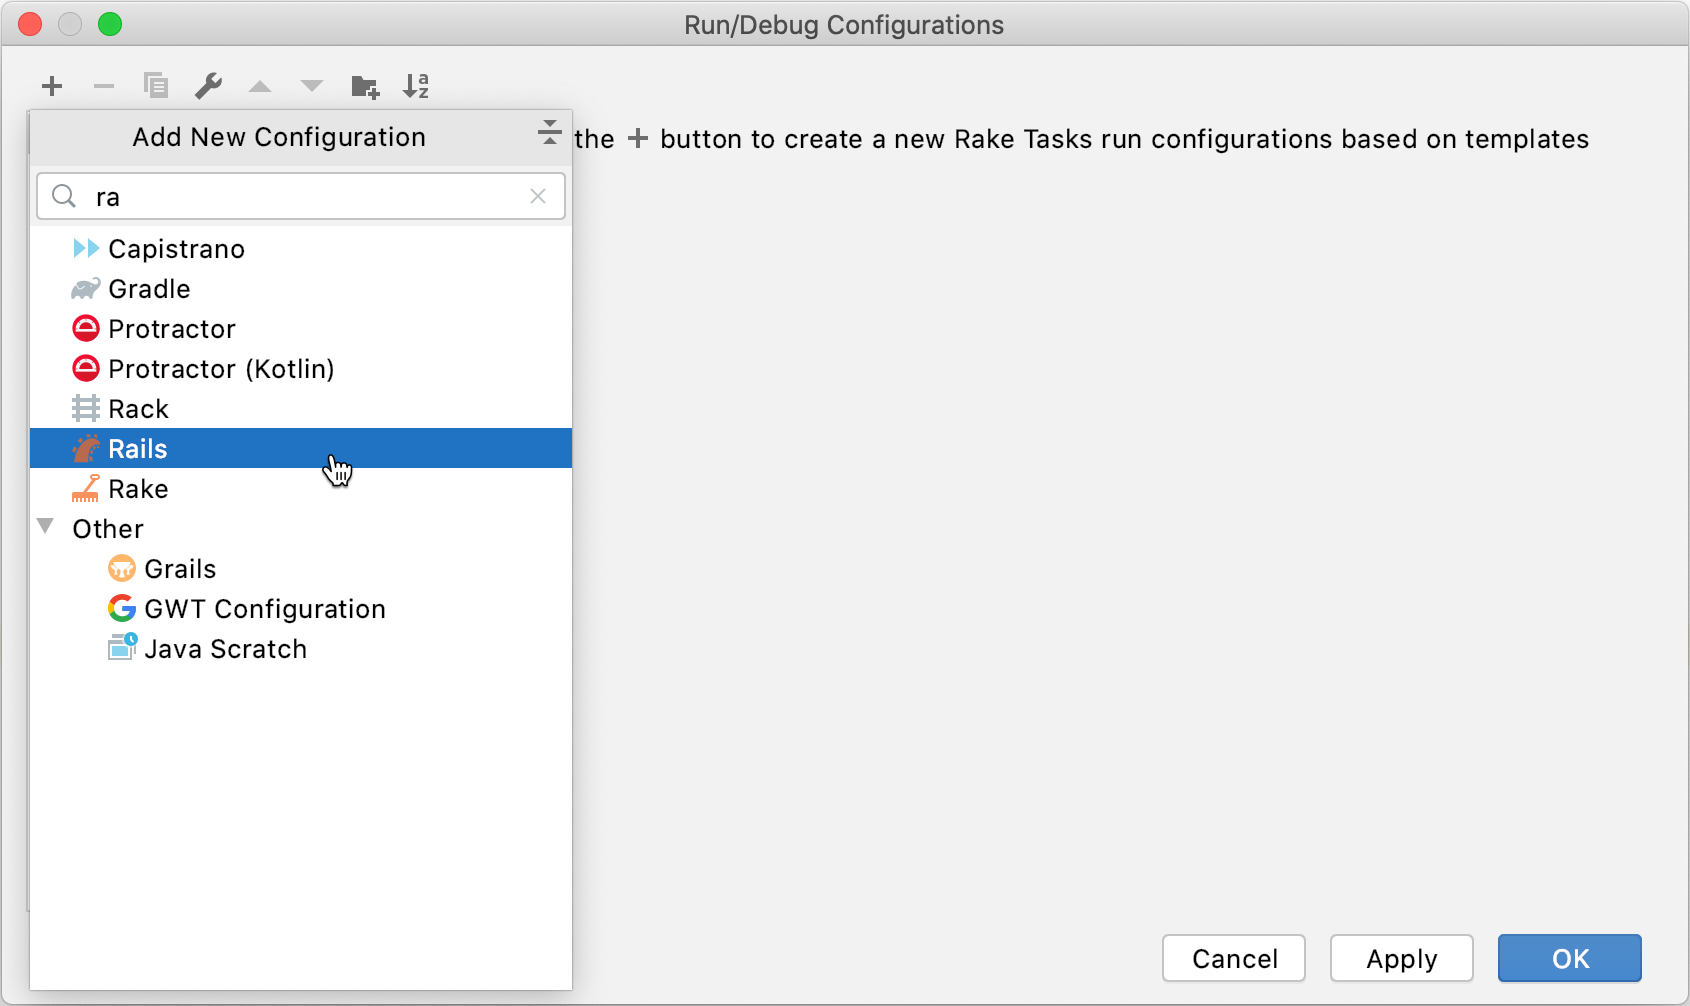
To run and debug our Rails application, we need to create a corresponding Rails configuration. Press Ctrl+Shift+A and start typing edit configurations. Select Edit Configurations and press Enter.

In the invoked Run/Debug Configurations dialog, click , start typing Rails and select it from the list.
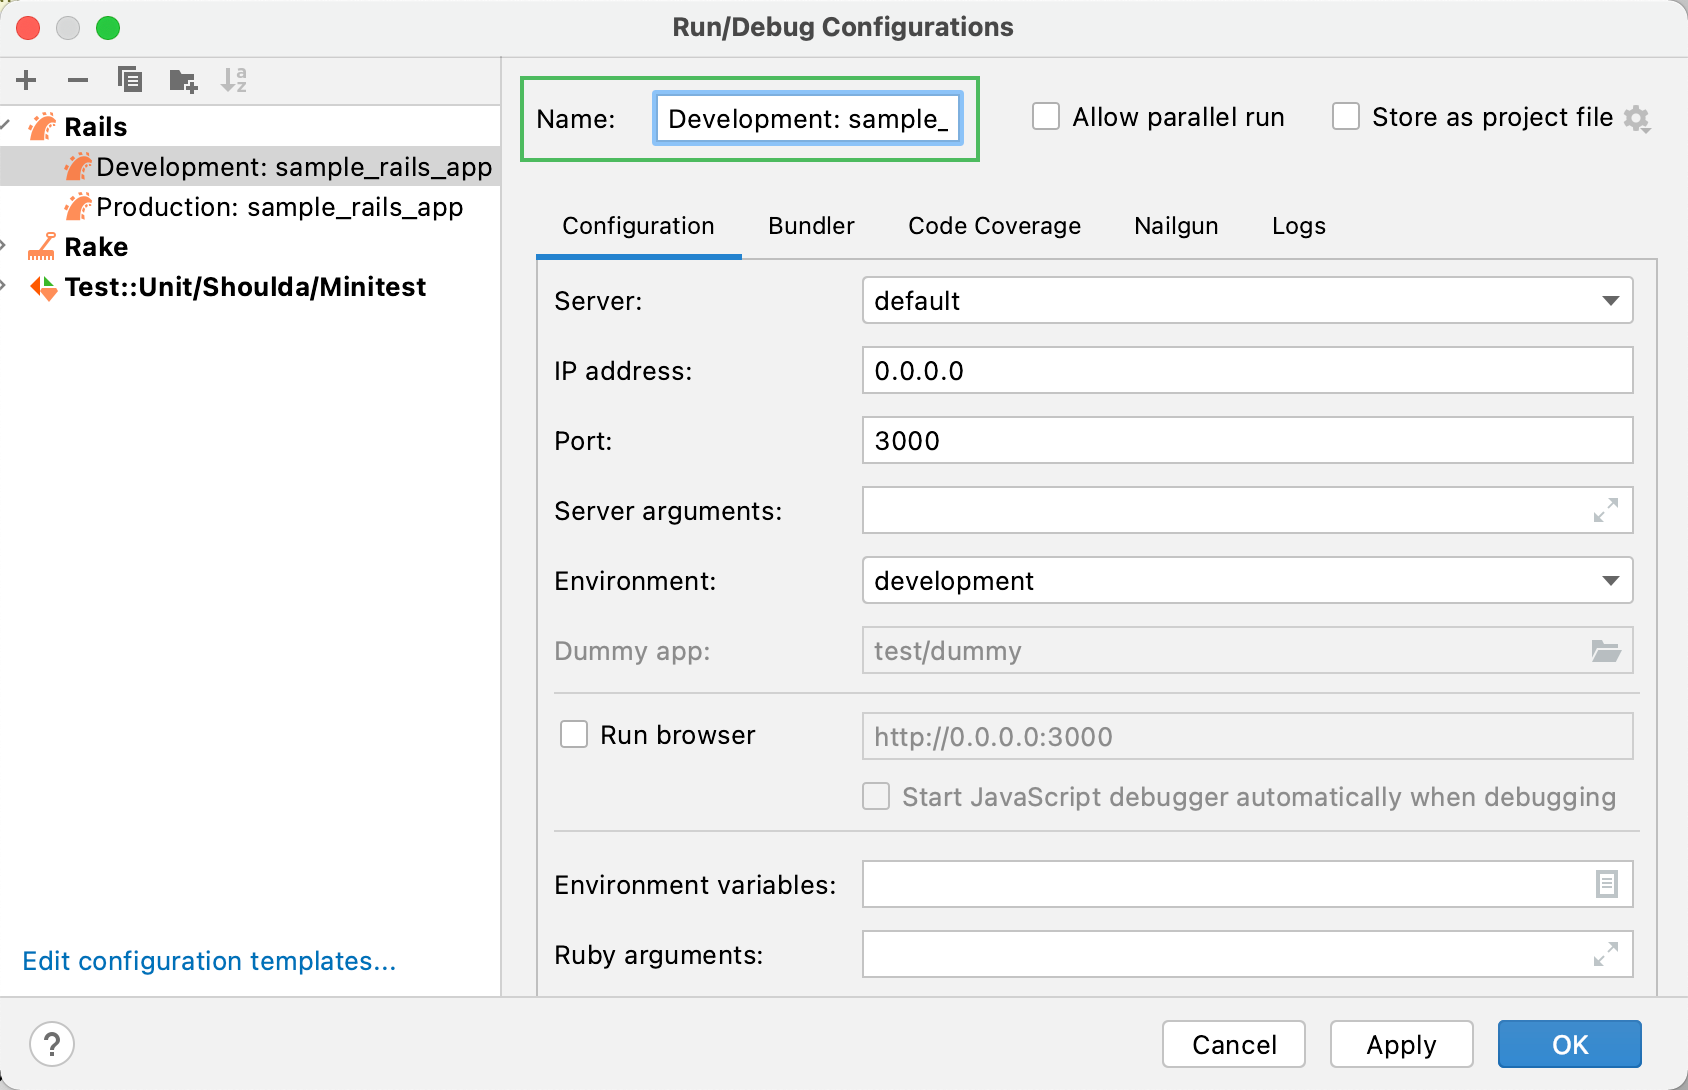
Change the created configuration name to Development: sample_rails_app and click OK.
Run an application
To run our Rails application, press Ctrl twice and start typing development. Select the Development: sample_rails_app configuration from the list and press Enter.

IntelliJ IDEA will show the process of preparing the application to run.
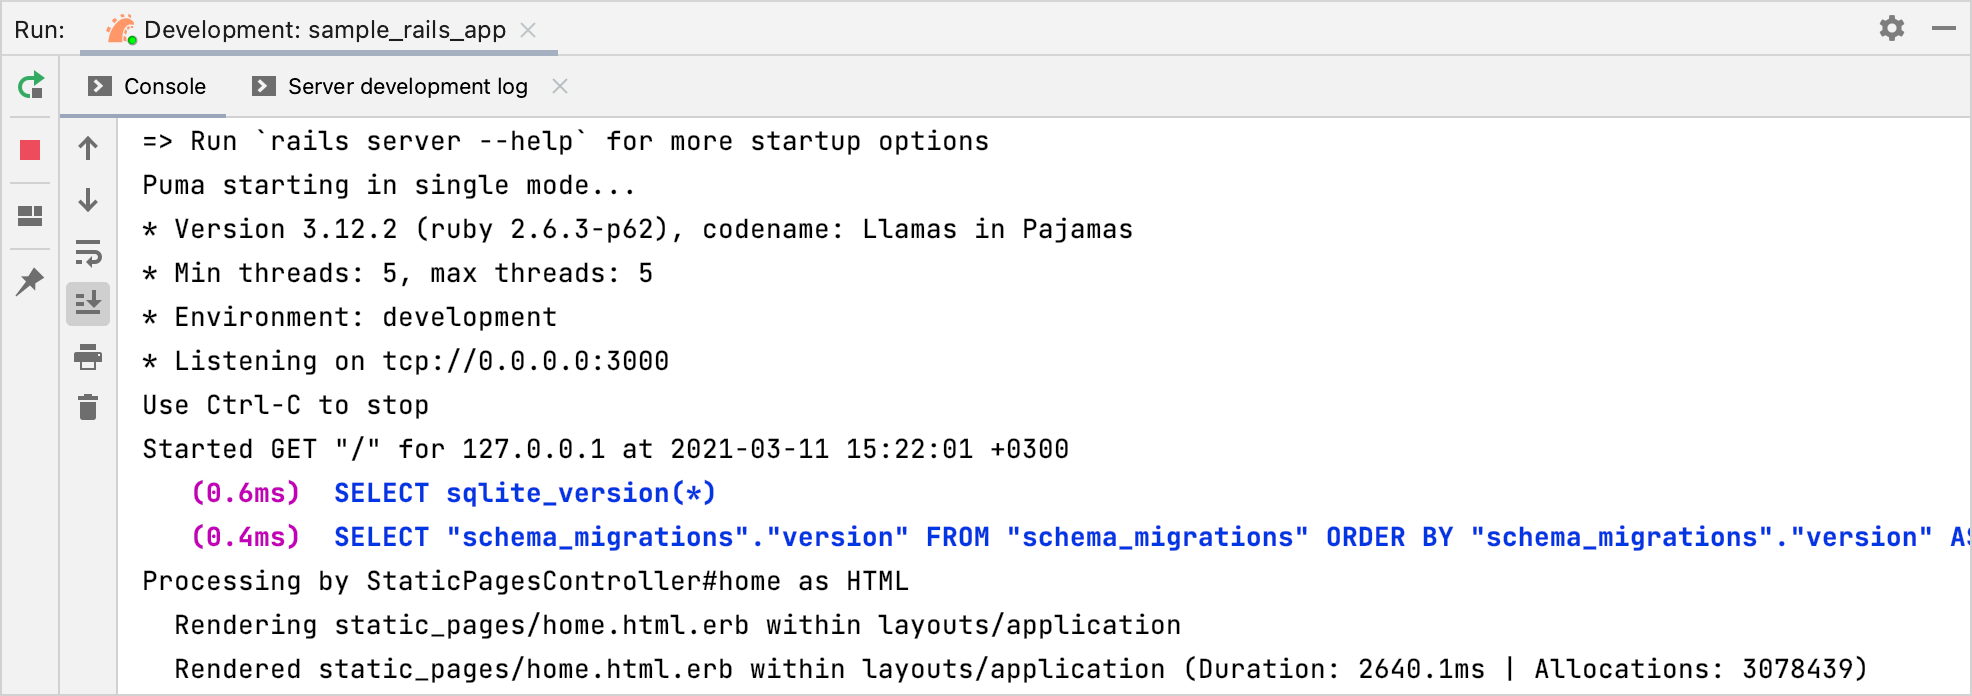
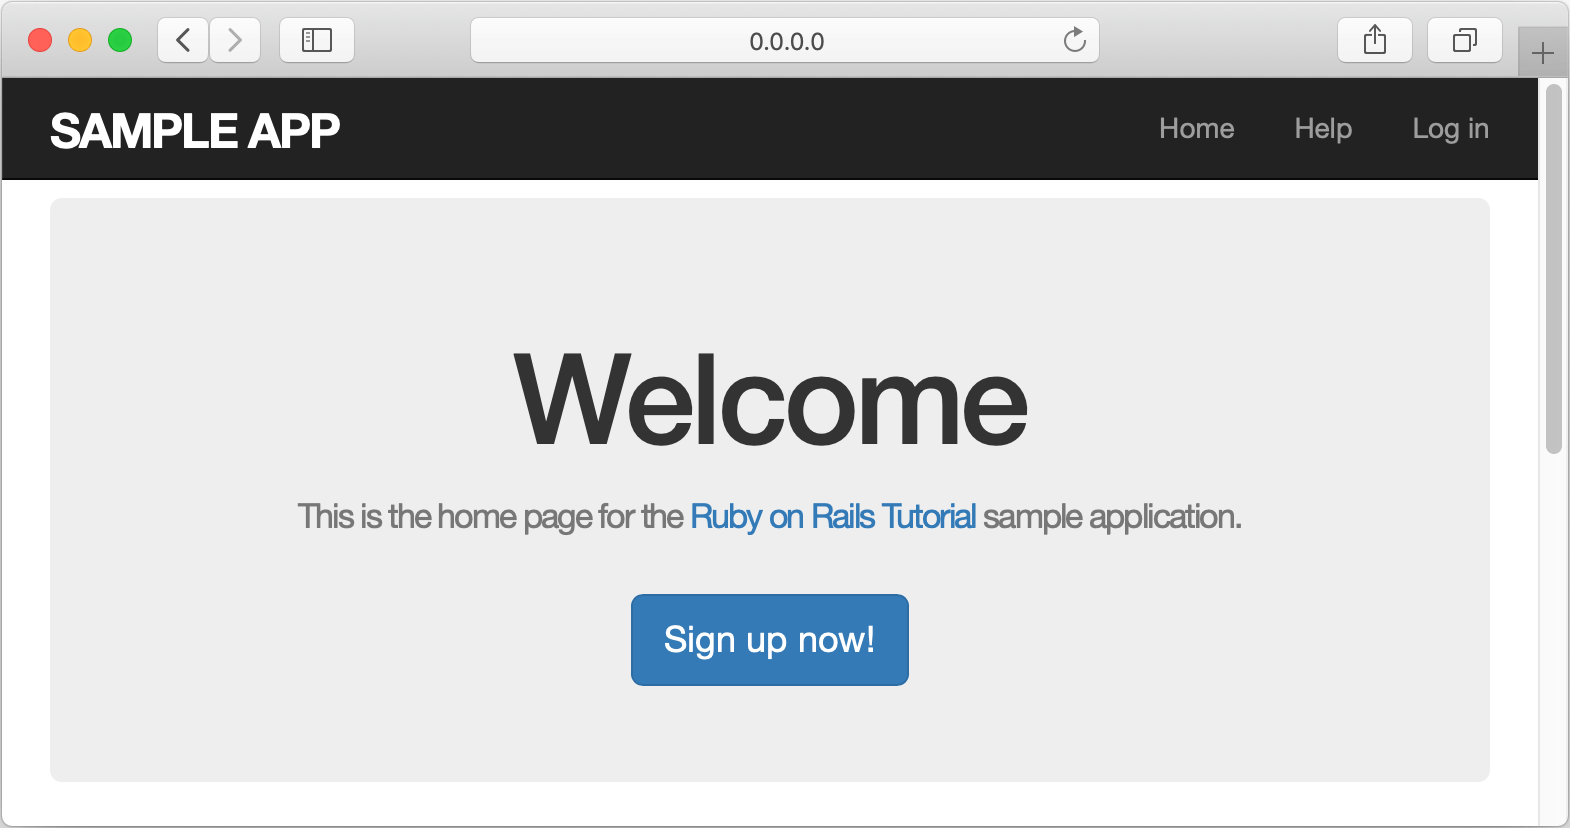
Copy the 0.0.0.0:3000 address used by a web server, insert it to the browser’s address bar and press Enter to see our working application.
Debug an application
One of the key features of IntelliJ IDEA is debugging support. The debugger provides various ways to examine the state of a running application. You can step through your code and check variable values, set watches on variables to see when values change, and so on.
Set a breakpoint and start debugging
First, open the users_controller.rb file. Set a breakpoint within the create method next to the line where a new user is created.
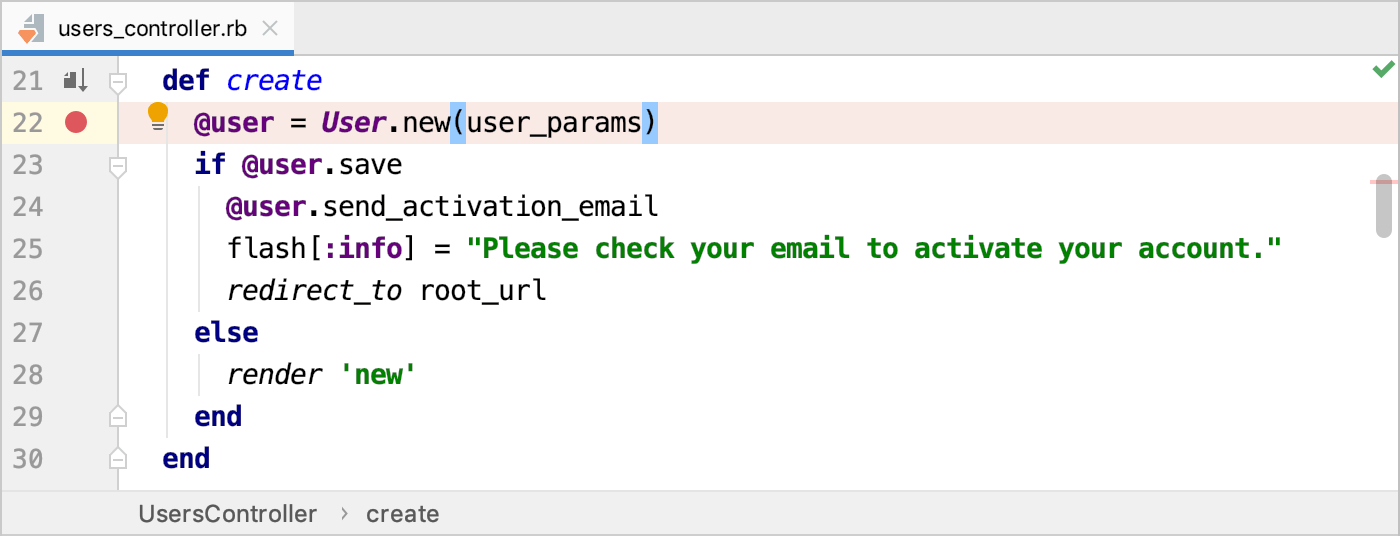
To start debugging, press Ctrl twice and start typing sample_rails_app. Select the Development: sample_rails_app configuration from the list, hold down the Shift key (the dialog title will be changed to Debug), and press Enter.

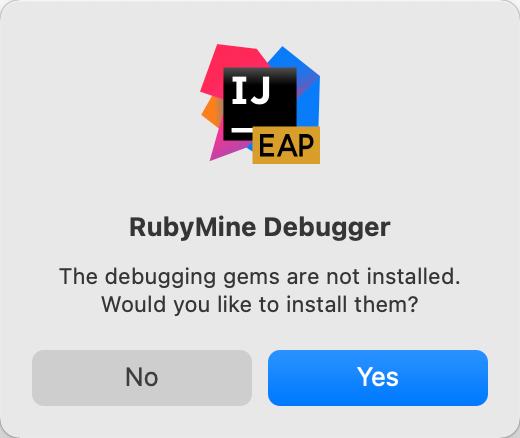
If the debase and ruby-debug-ide gems required for debugging have not been installed yet, IntelliJ IDEA suggests installing them.
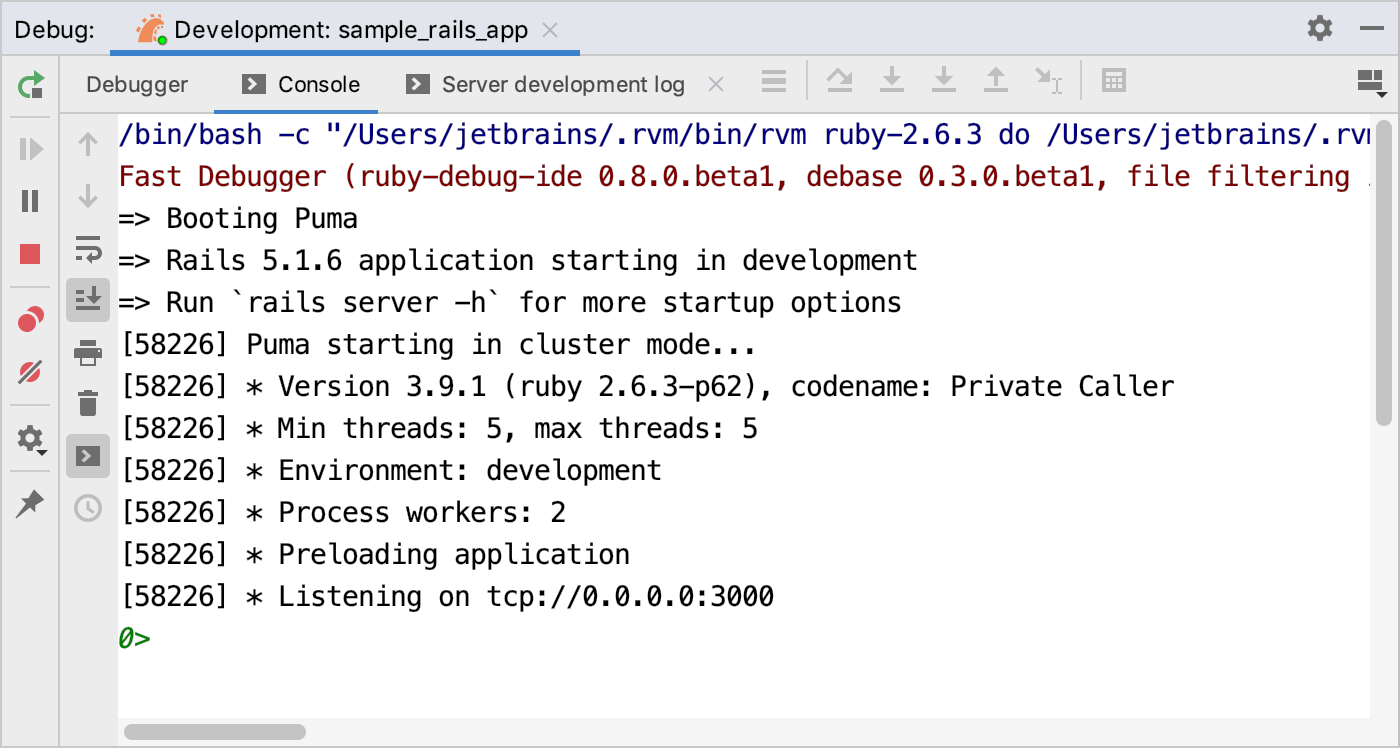
After installing the gems, the Debug tool window will show the application output.
Open a browser on the local machine and specify the application address 0.0.0.0:3000.

Click the Sign up now! button. On the Sign up page, enter your credentials and click Create my account.
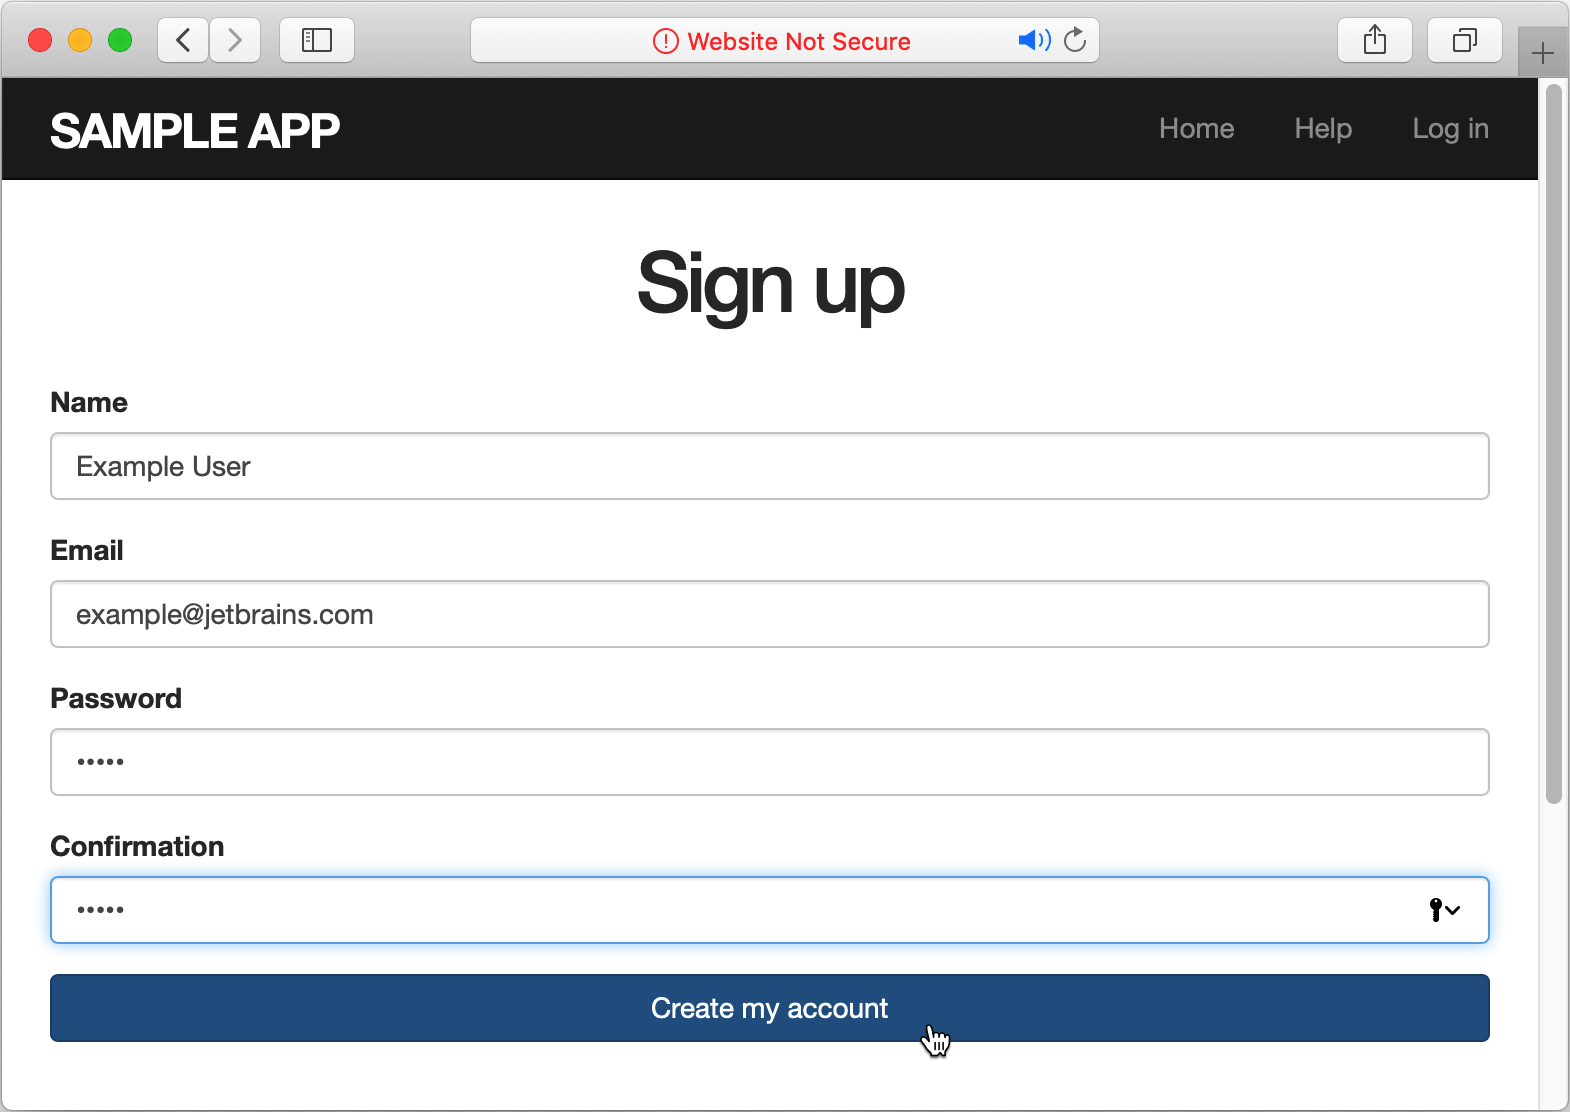
The program will stop when it reaches the breakpoint.
Examine variables
You can now examine the application state and the values of variables.
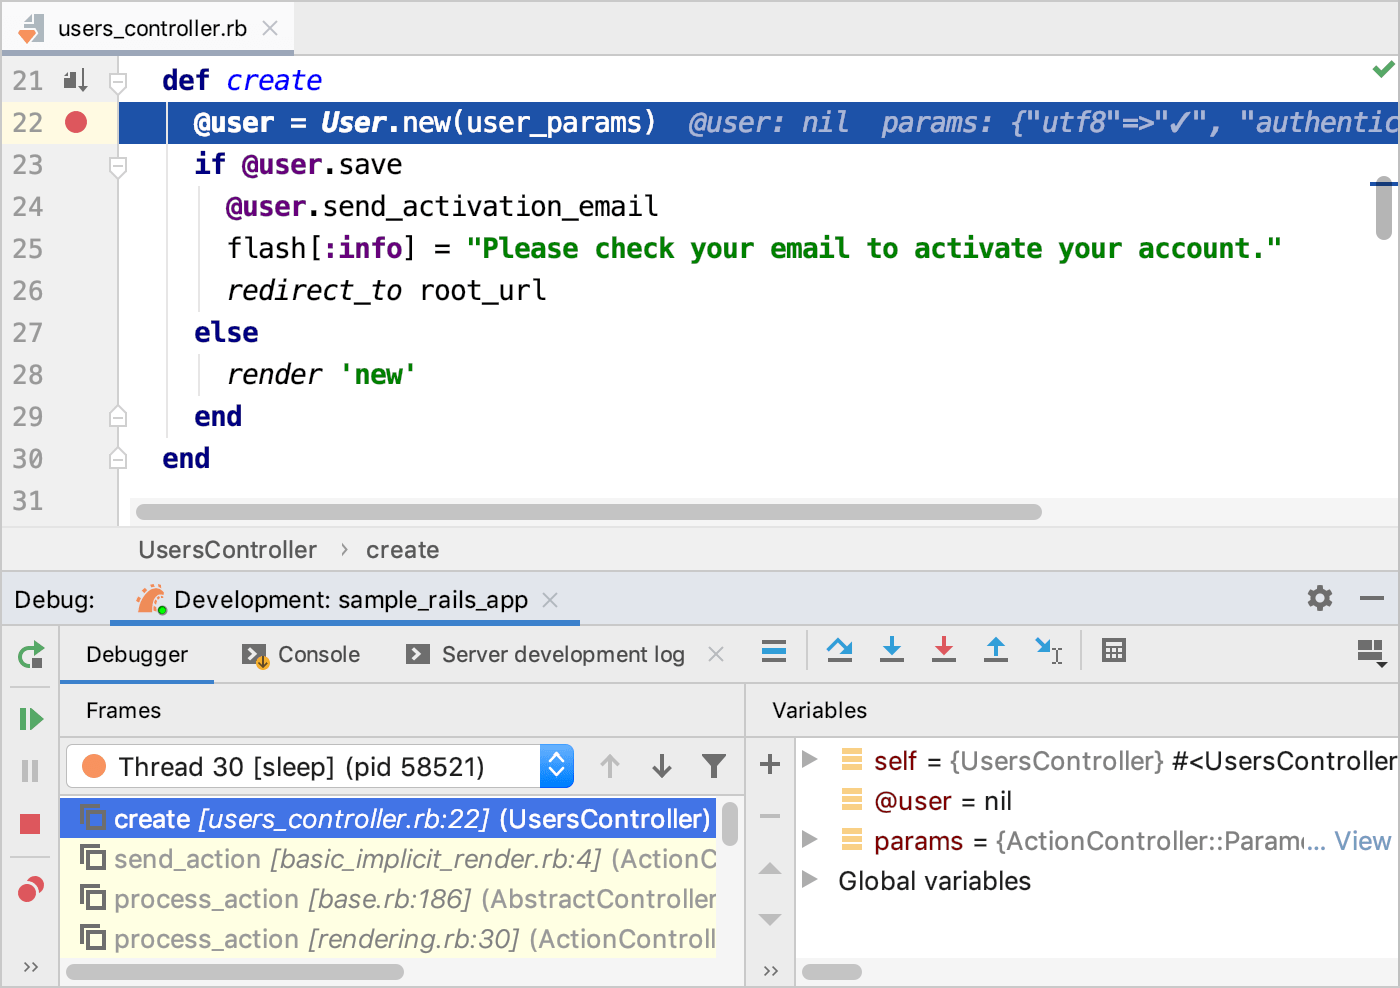
The Frames pane displays the application threads and the corresponding call stacks. In our case, the create method is called in Thread 30. The Variables pane allows you to examine variables available in the current context.
Let’s add the user_params variable to the list. Click the button in the Variables pane and start typing user_params. Select the user_params variable in the invoked drop-down and press Enter.
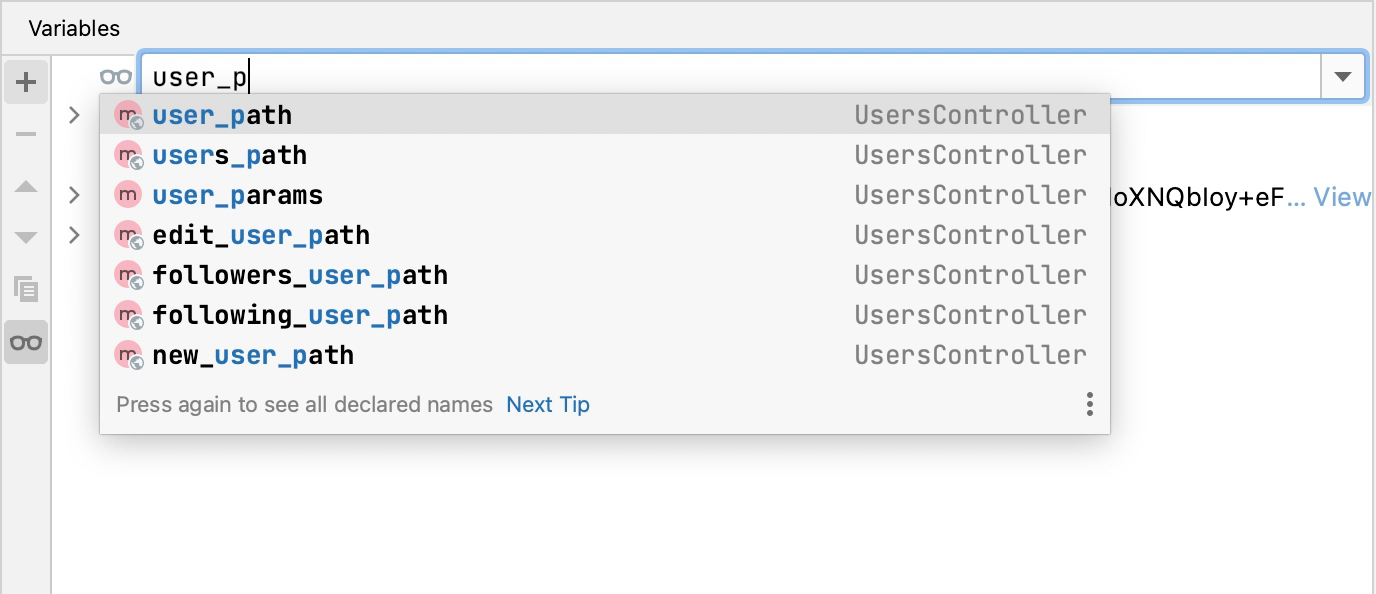
Then, click the button next to this variable and then expand the @parameters variables in the same way. You can see the user credentials specified in the Sign up form.
Once the breakpoint is hit, we can step through the code.
Step over
Step over proceeds to the next line in the current scope (for example, goes to the next line), without descending into any method calls on the way.
On the screen below, you can see that the User object is not created yet and the @user variable not initialized (equals nil).
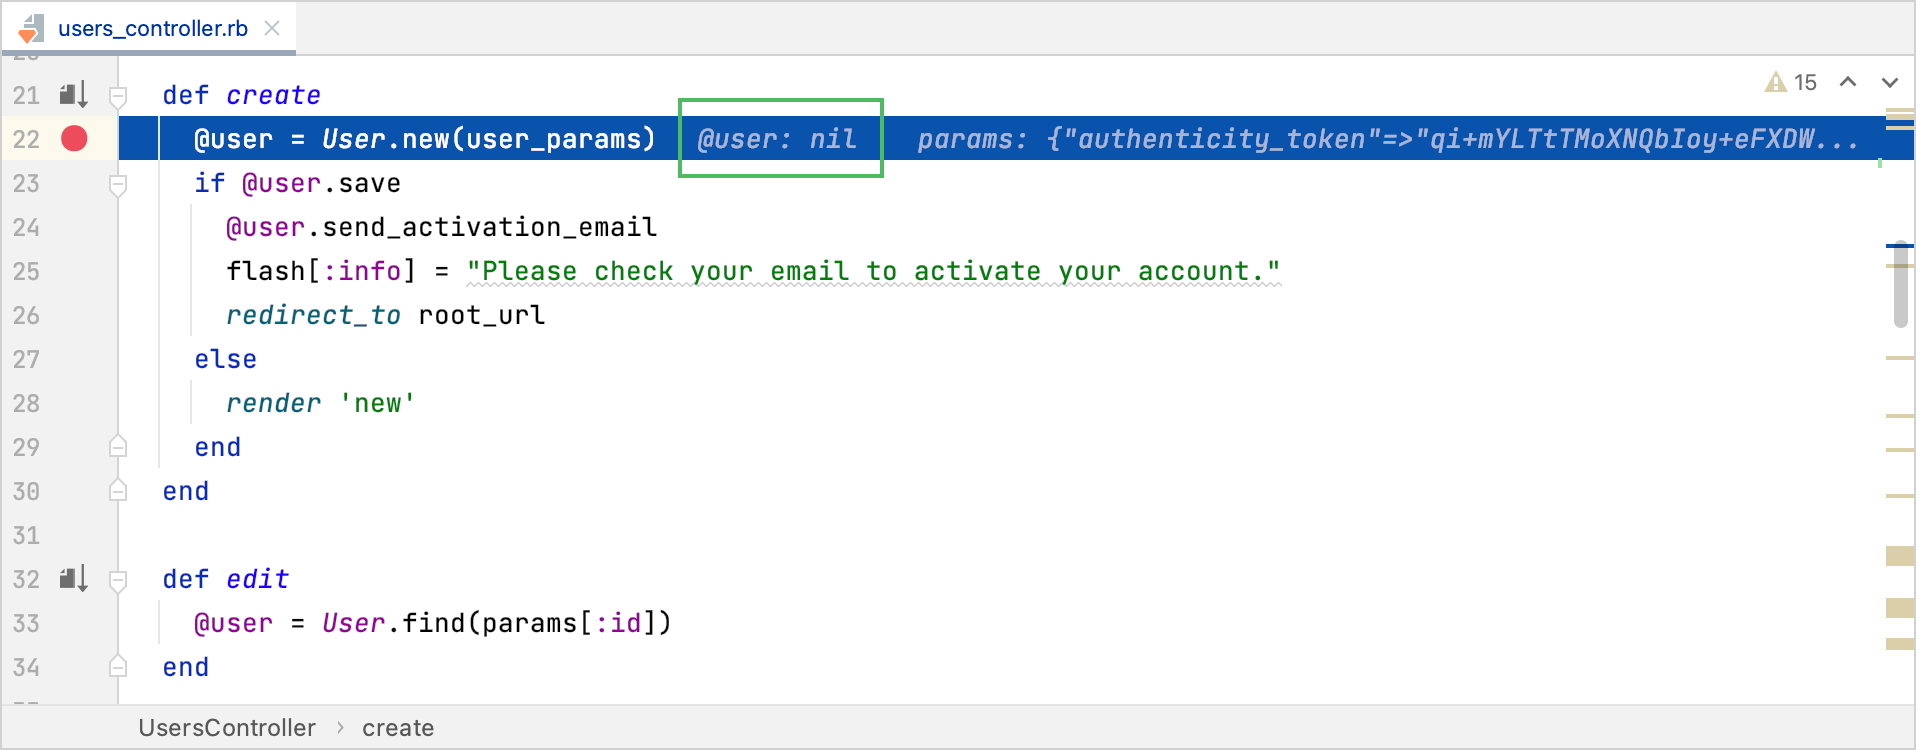
Press F8 or click the button in the Debug window toolbar. The debugger will go to the next line - the if statement. In the editor and Variables pane, you can see that the @user variable was initialized.
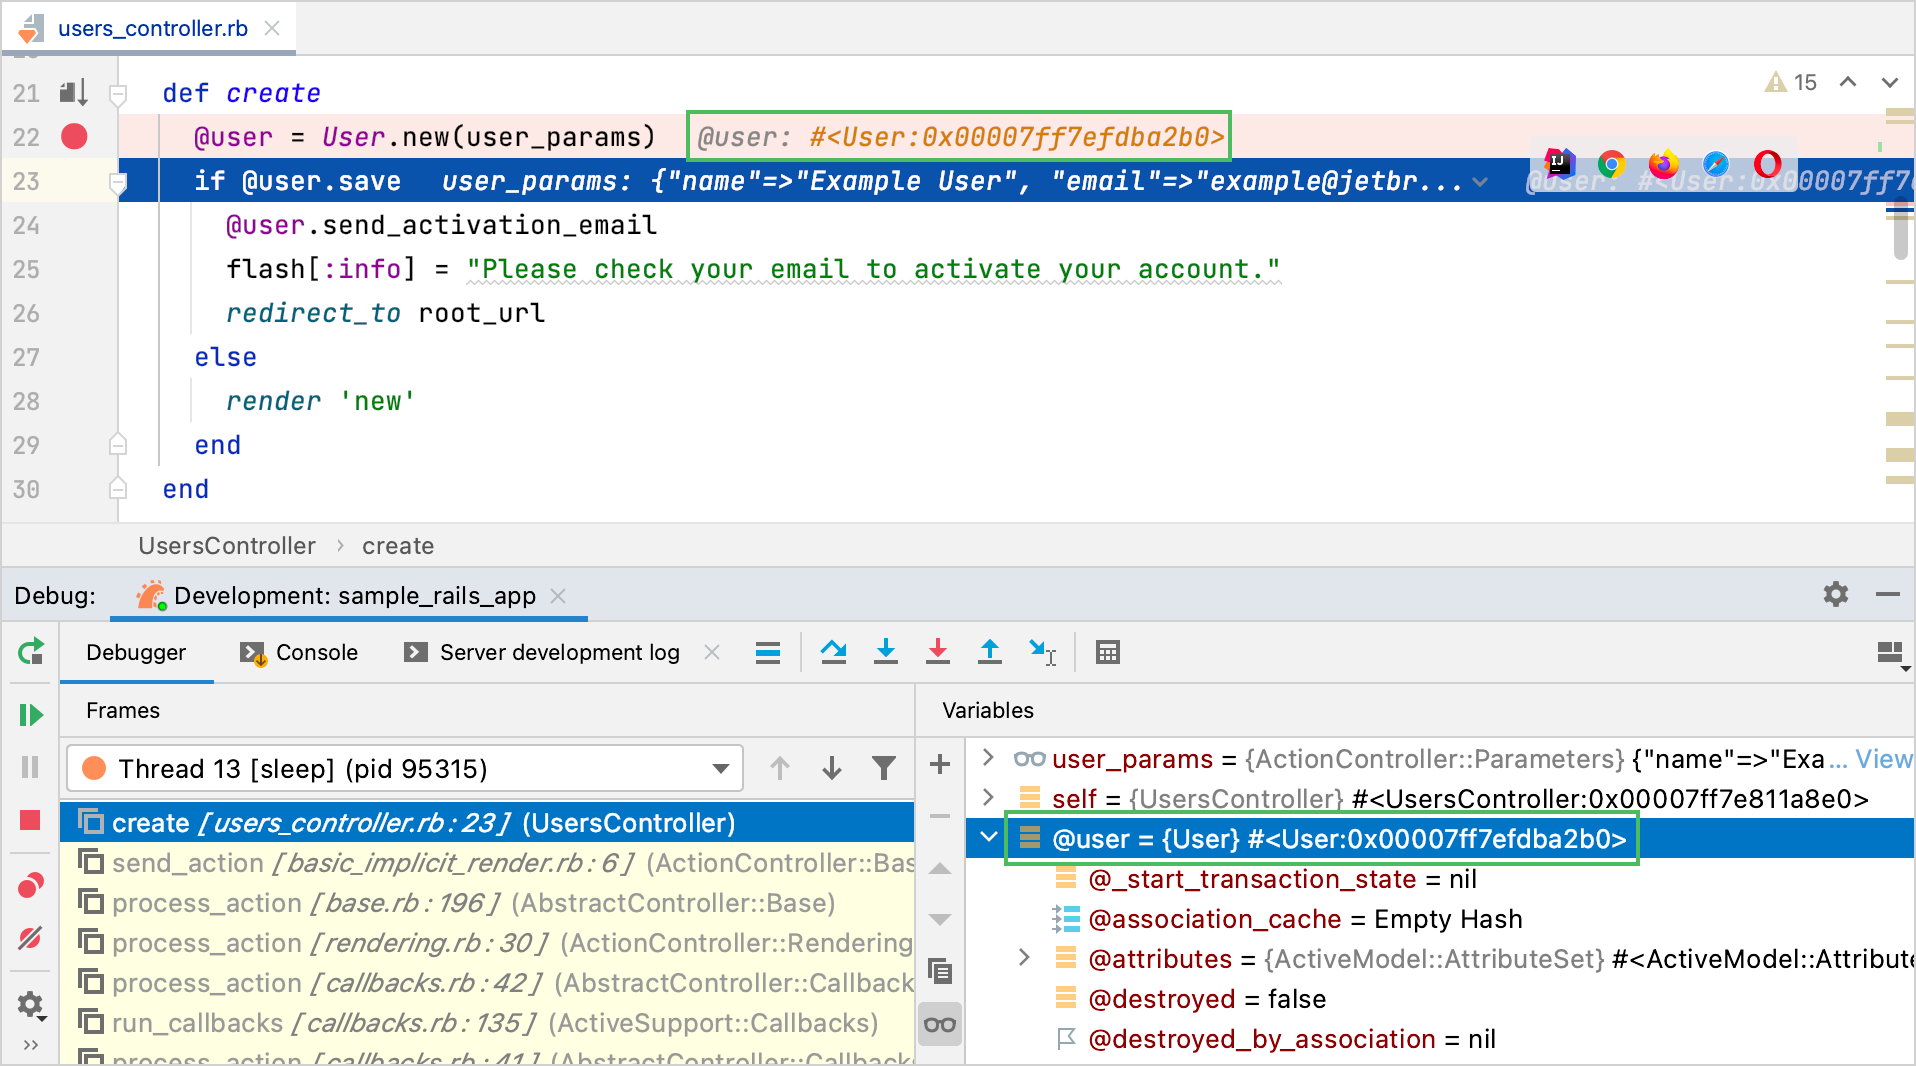
Use the button to examine @user properties.
Step into
Step into will cause the debugger to descend into the method calls or blocks on the current line and follow them through. If there are multiple method calls or blocks, you can choose the desired target.
Click the button to resume program execution. Go to the browser again and create another user in the Sign up form. The script will stop when it reaches the line where a user is created.
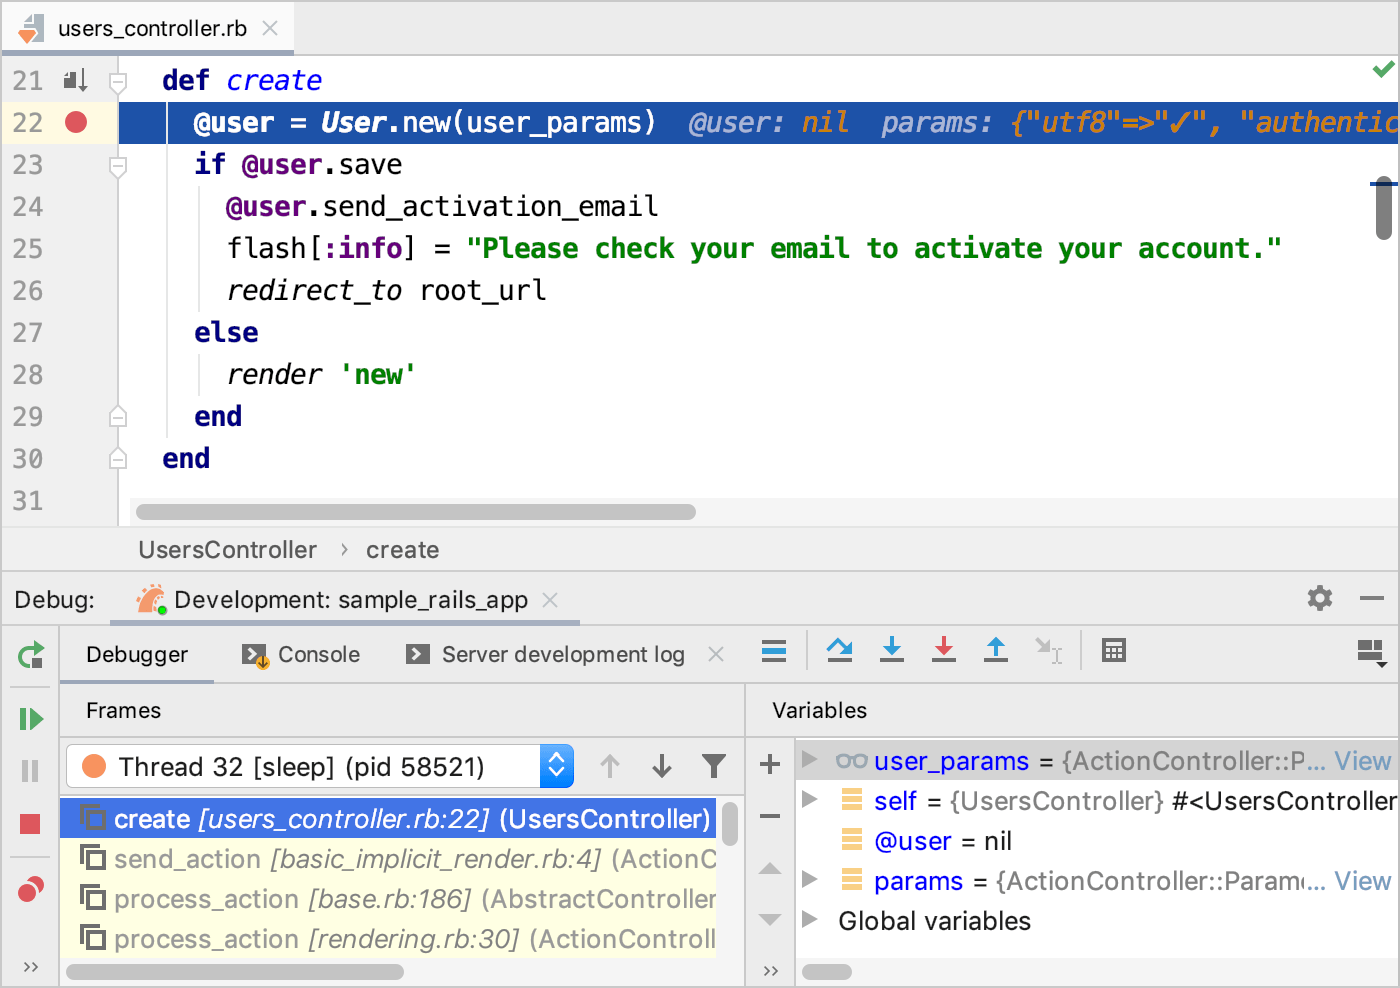
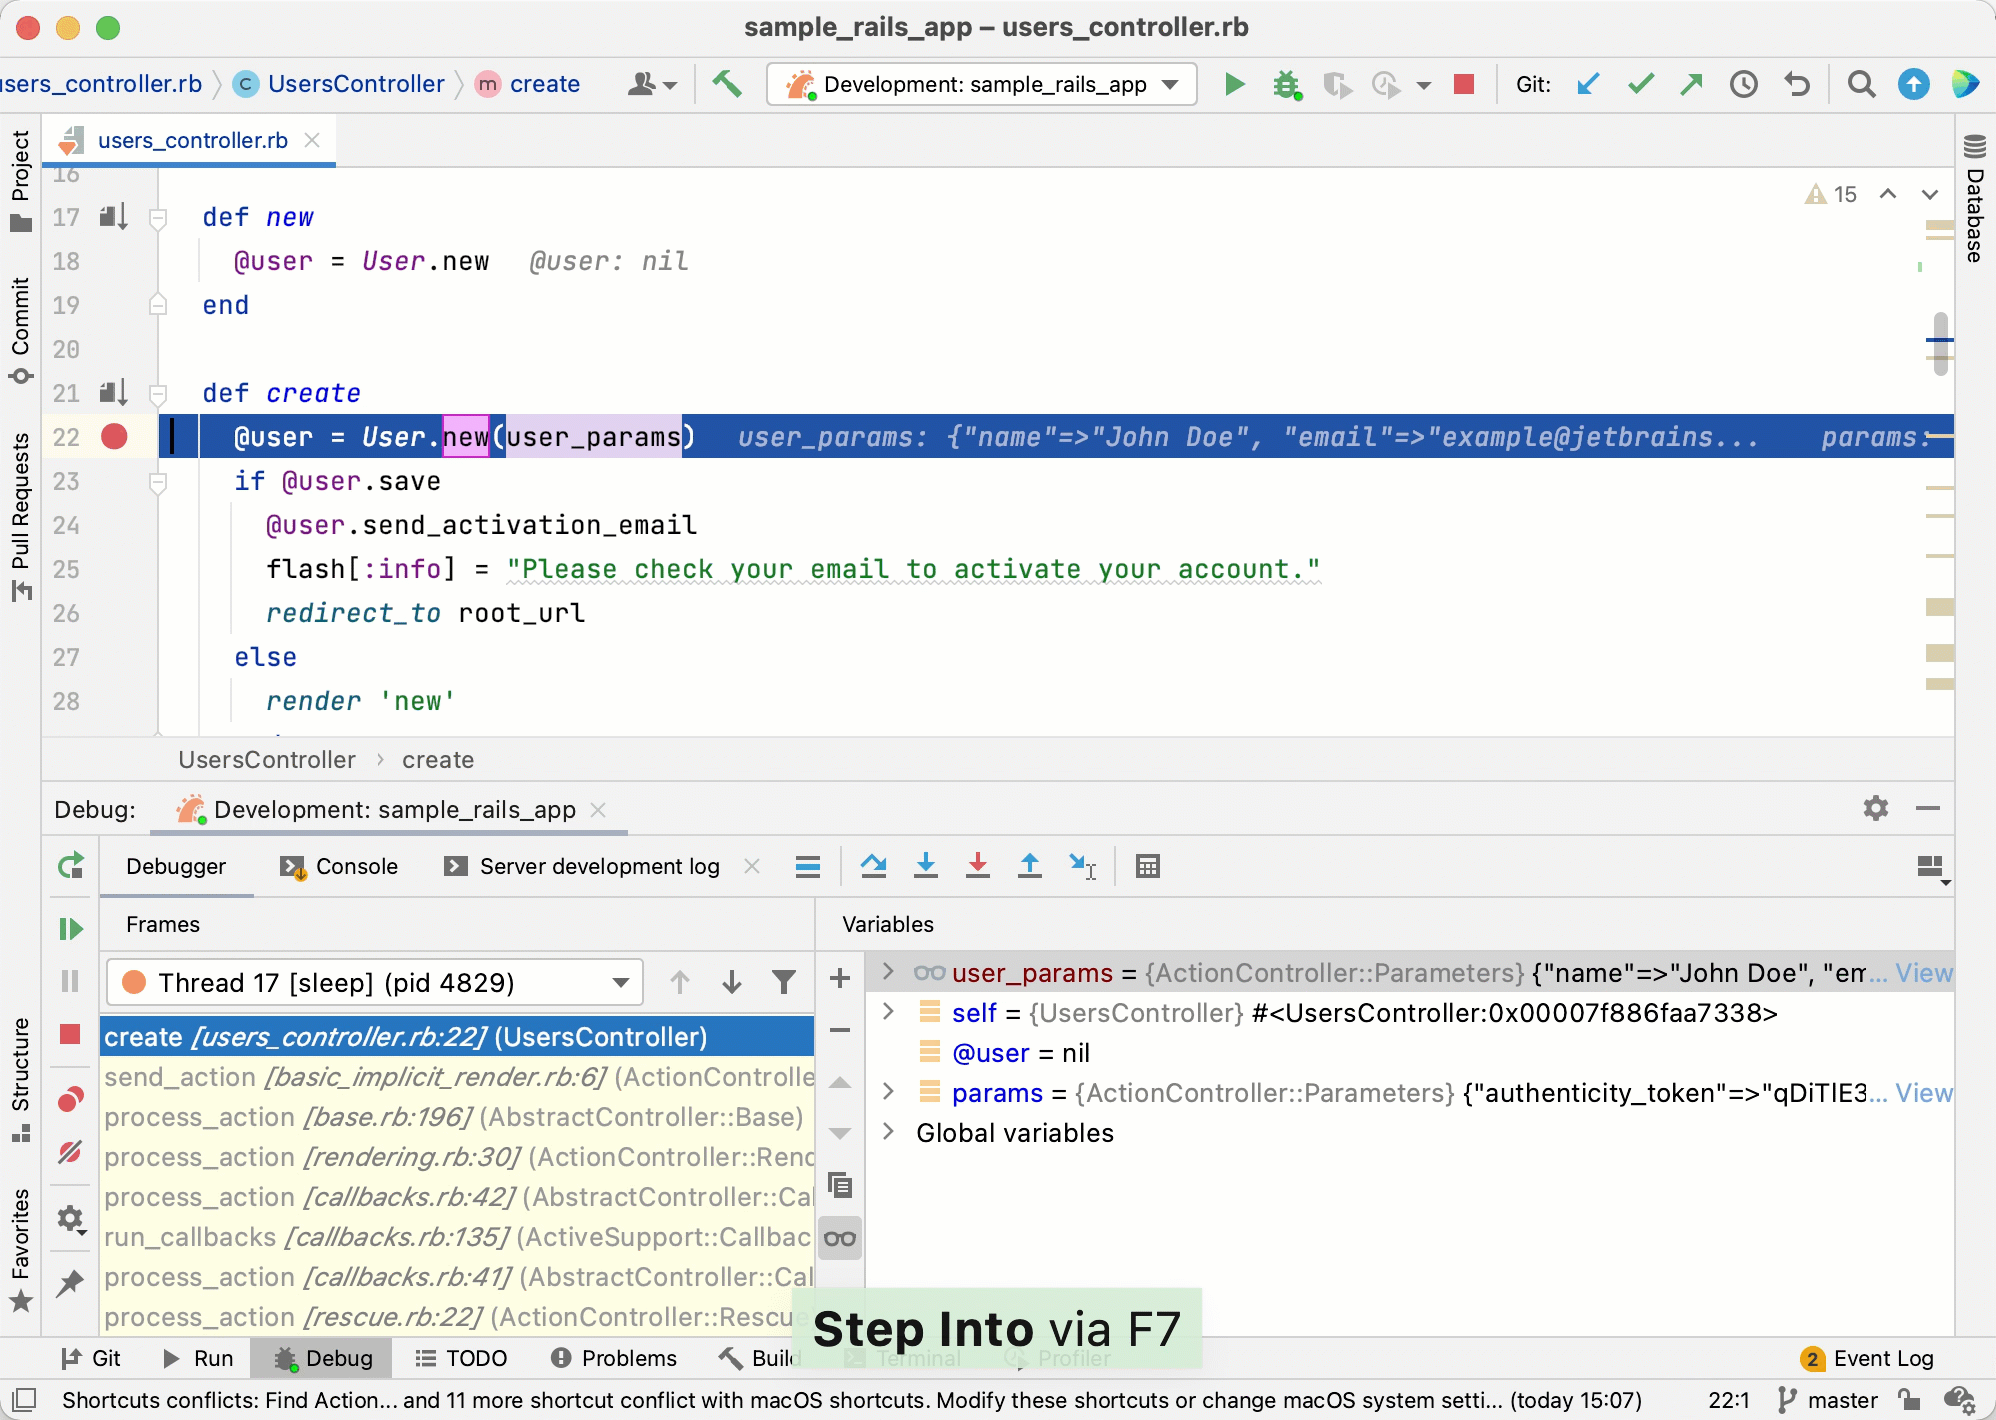
Press F7 or click the button. The editor will set a focus on the user_params method. You can use arrow keys or Tab to choose the desired method to step into (new or user_params in the example below). Select user_params and press Enter. The program execution will jump to the user_params method definition.
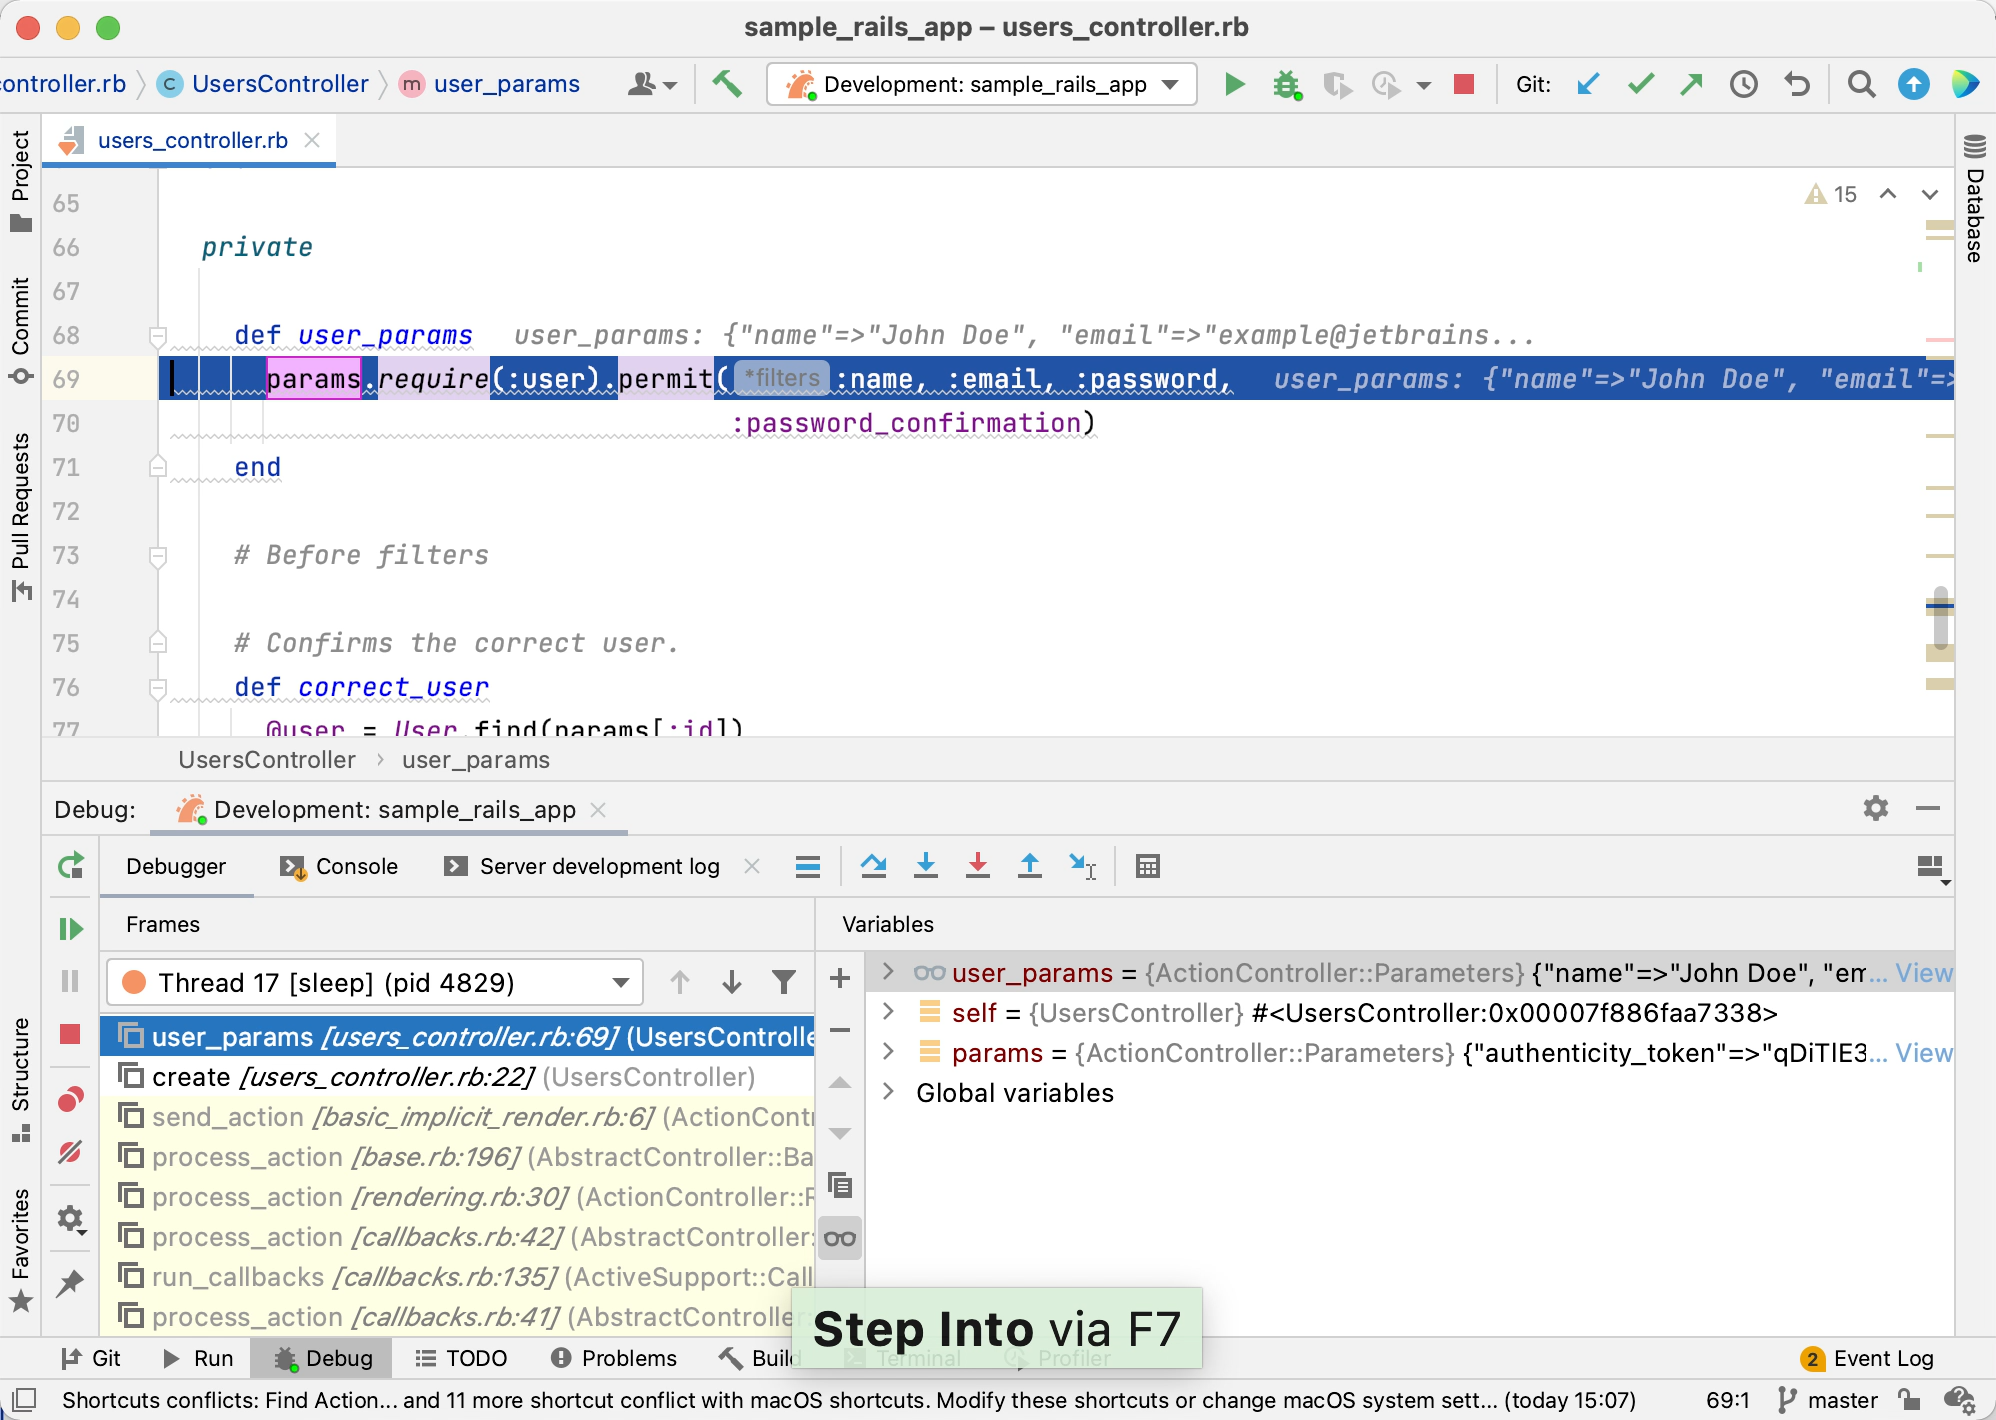
If you press F7 another time, the debugger will suggest selecting between the params and require methods from the StrongParameters module.
Debug in console
The debugger has the Console tab that enables you to interact with a debugged application with an IRB-like console.
Start typing user_params in the console, select the corresponding variable and press Enter.

The Console window will display the values of variables.