Code inspections
In GoLand, there is a set of code inspections that detect and correct abnormal code in your project before you compile it. The IDE can find and highlight various problems, locate dead code, find probable bugs, spelling problems, and improve the overall code structure.
Inspections can scan your code in all project files or only in specific scopes (for example, only in production code or in modified files).
Every inspection has a severity level — the extent to which a problem can affect your code. Severities are highlighted differently in the editor so that you can quickly distinguish between critical problems and less important things. GoLand comes with a set of predefined severity levels and enables you to create your own.
Inspections and their settings are grouped in profiles. Each profile contains the information on the enabled inspections, a scope of files that they analyze, and their severity levels.
Access all available inspections and their settings
In the Settings dialog (Ctrl+Alt+S) , go to .
You can also press Ctrl+Alt+Shift+H and select Configure Inspections in the popup that opens.
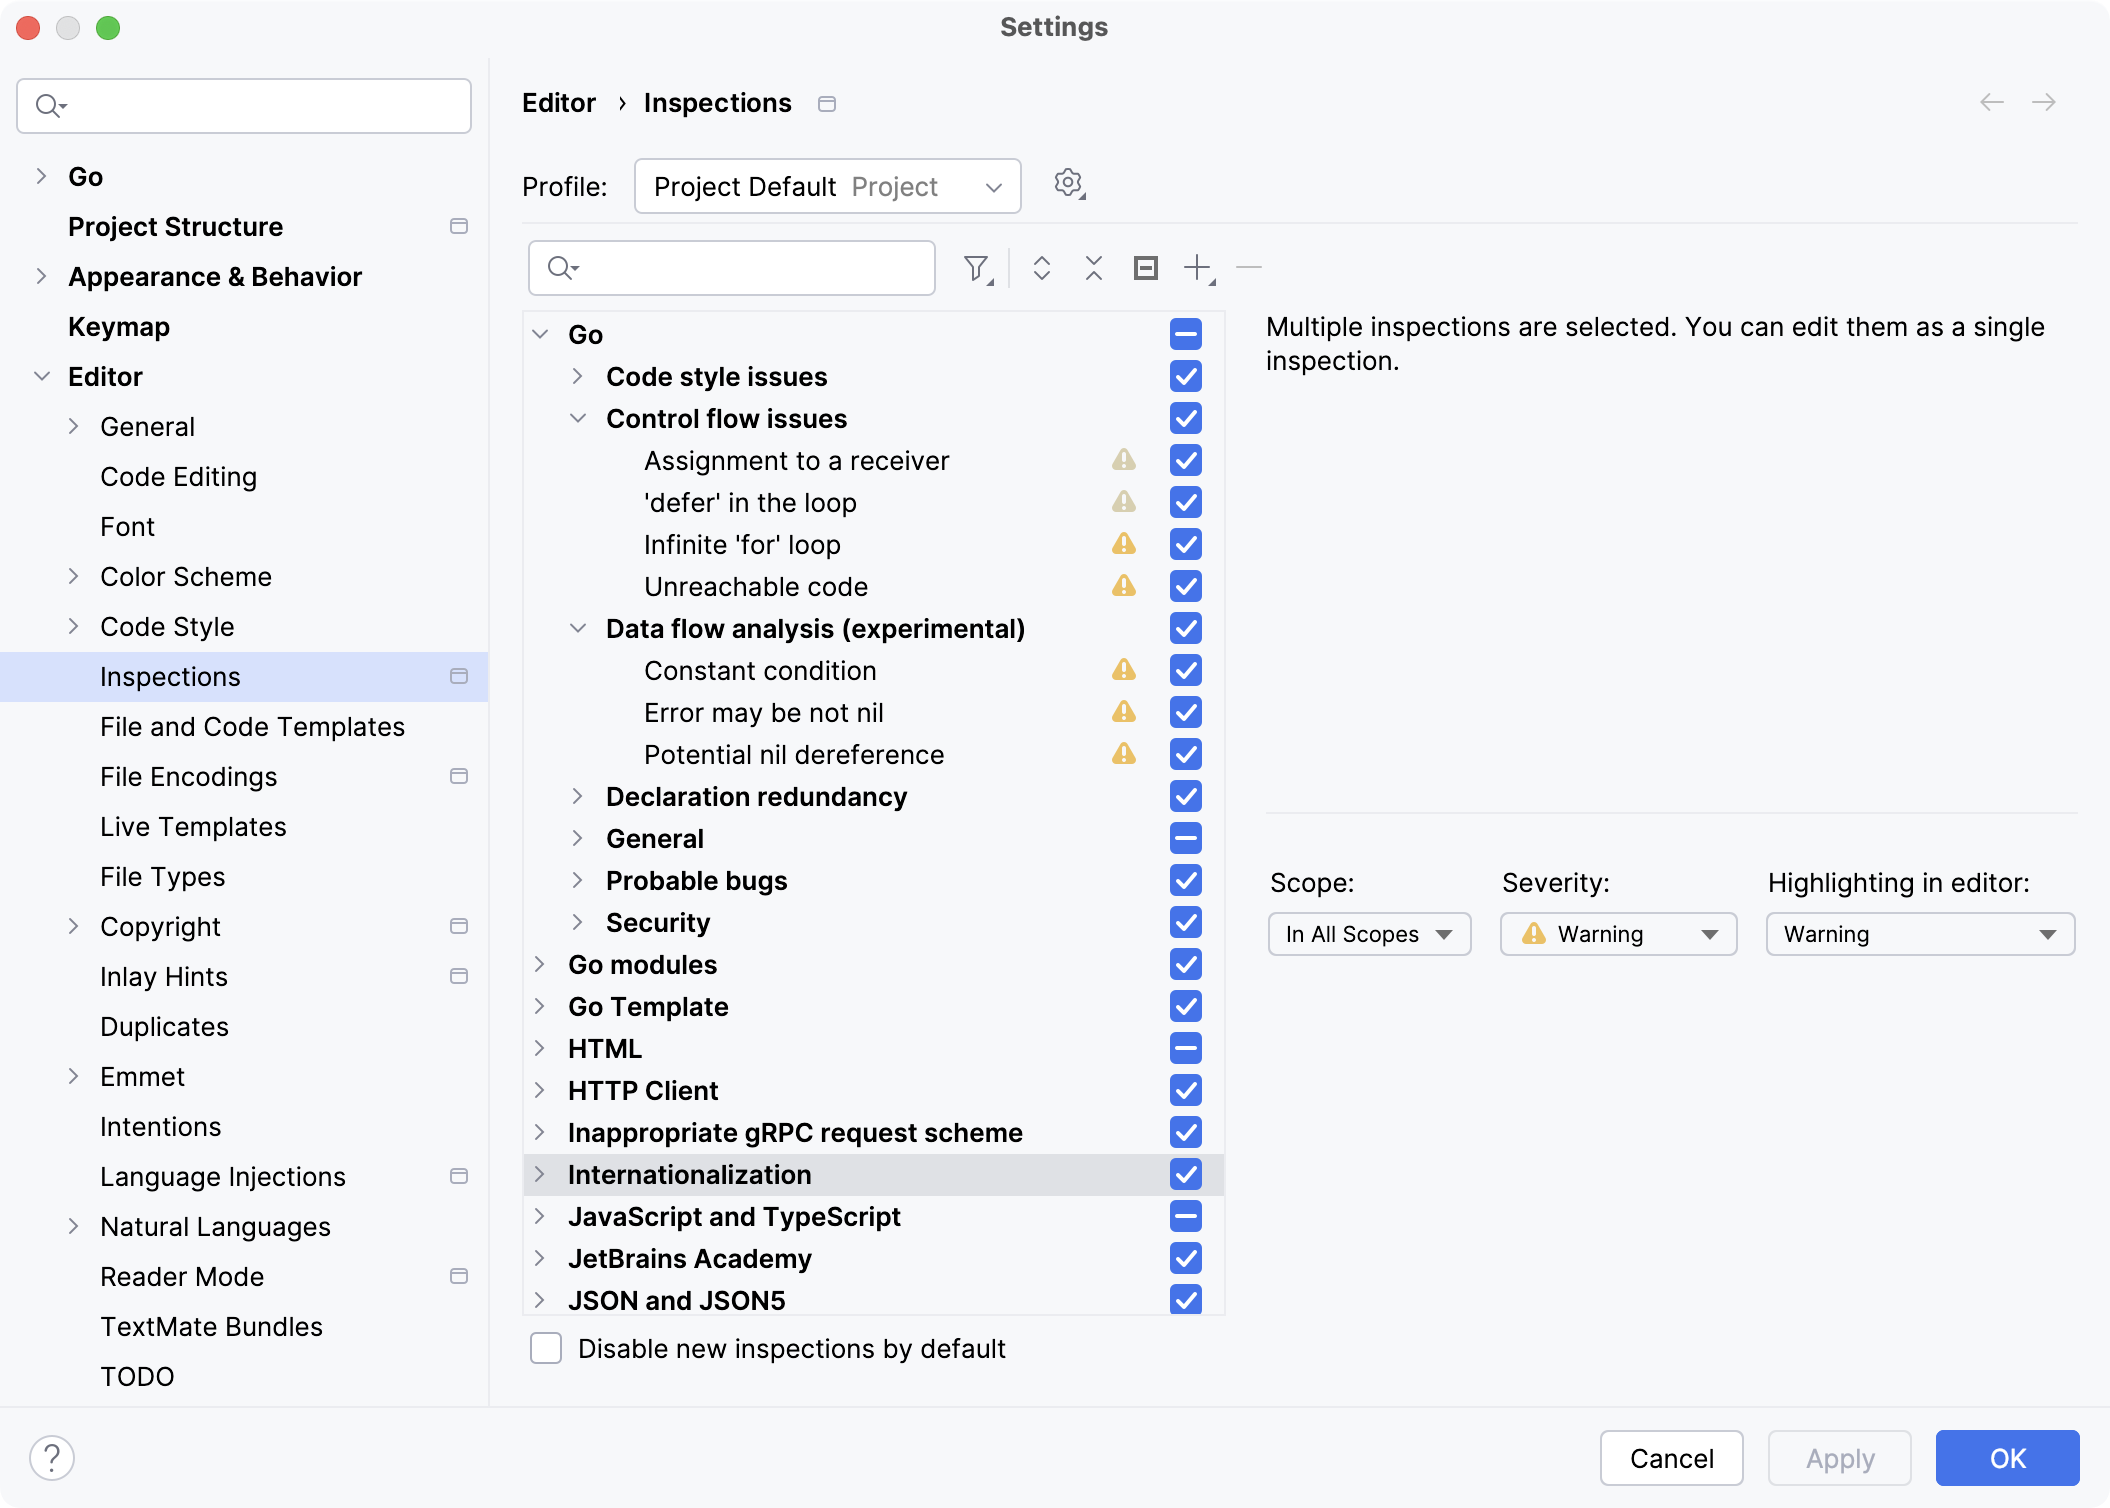
Use to filter the inspection list. For example, you can filter inspections by severity or by language.
Data flow analysis
Data flow analysis (DFA) is a method used in programming to understand how data moves through a program. Imagine your program as a map with different points, where each point is a part of your code (like a statement or instruction). These points are connected by lines that show the path the program takes as it runs. In GoLand, data flow analysis looks at this map to analyze your code.
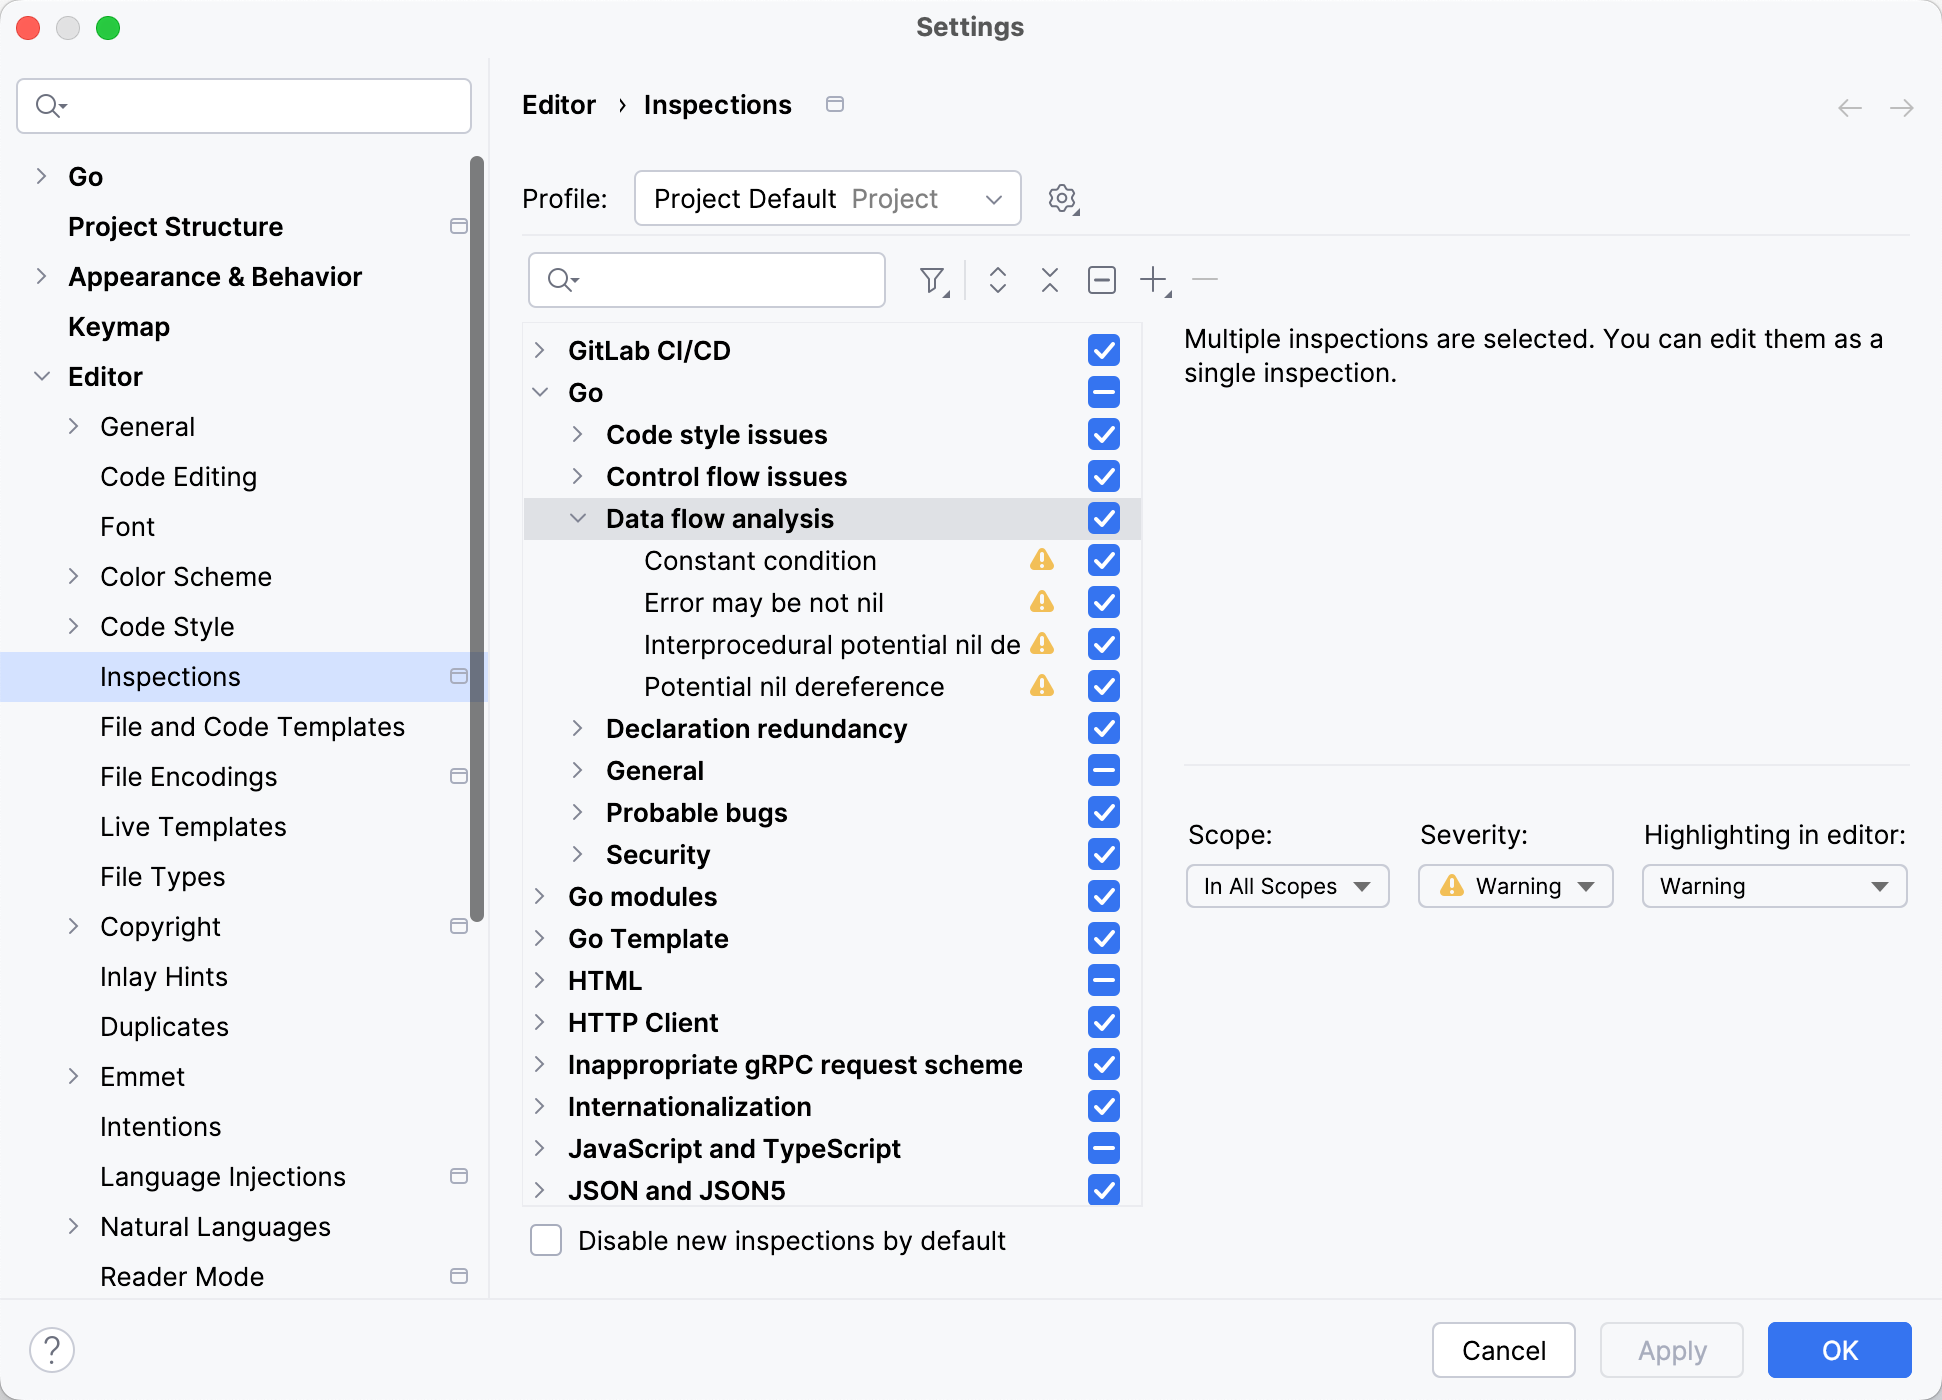
Data flow analysis for nil dereference
Nil pointer dereference is a common error in Go. It can cause unexpected panics, crashes, or deadlocks in production systems. Typical causes include accessing fields of a nil pointer or writing to a nil channel.
GoLand uses static code analysis to detect nil dereference issues. The standard nil dereference inspection works within individual functions (intraprocedural analysis) and can catch simple cases.
More complex problems occur when nil values move across functions, files, or packages. To catch these, GoLand provides interprocedural DFA. This feature tracks how values propagate through function calls, making it possible to detect potential nil dereference issues throughout the entire codebase.
For more information about the intraprocedural analysis, refer to the blogpost at blog.jetbrains.com.
Explain potential nil dereference
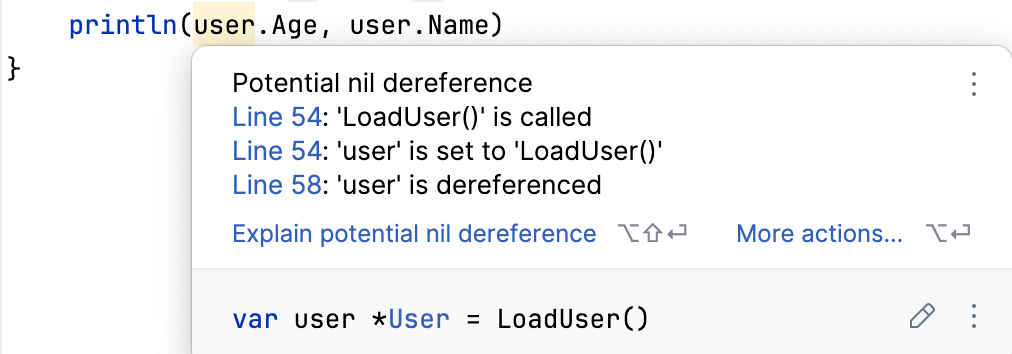
GoLand highlights possible nil dereference issues directly in the editor. When such a warning appears, you can use the Explain potential nil dereference action.
Hover over the warning or click the warning and press Alt+Enter, select Explain potential nil dereference.
This action opens the Data Flow Analysis tab in the Problems tool window. The tool shows a step-by-step explanation of how the
nilvalue propagates through the code and where it is used. This helps you understand the problem and fix it efficiently, without searching through the entire codebase.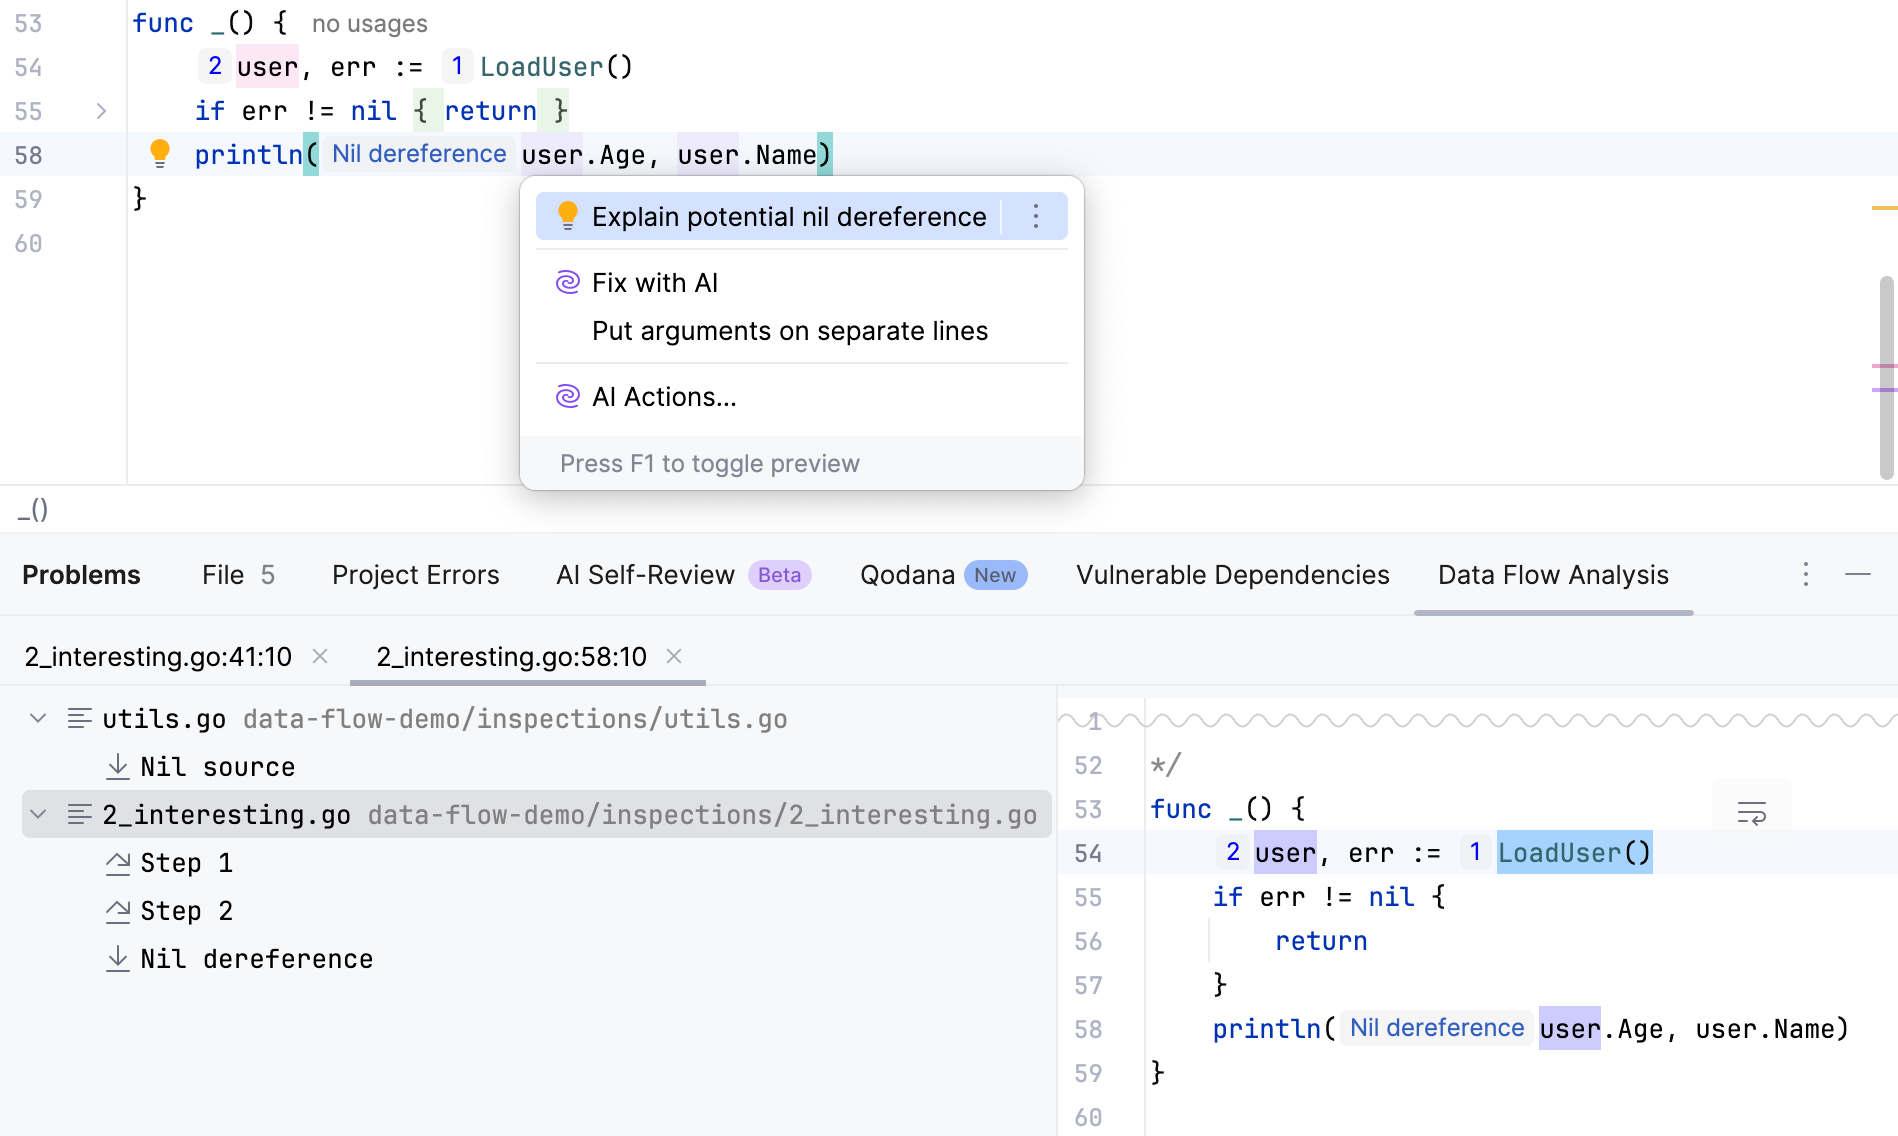
View nilability information in quick documentation
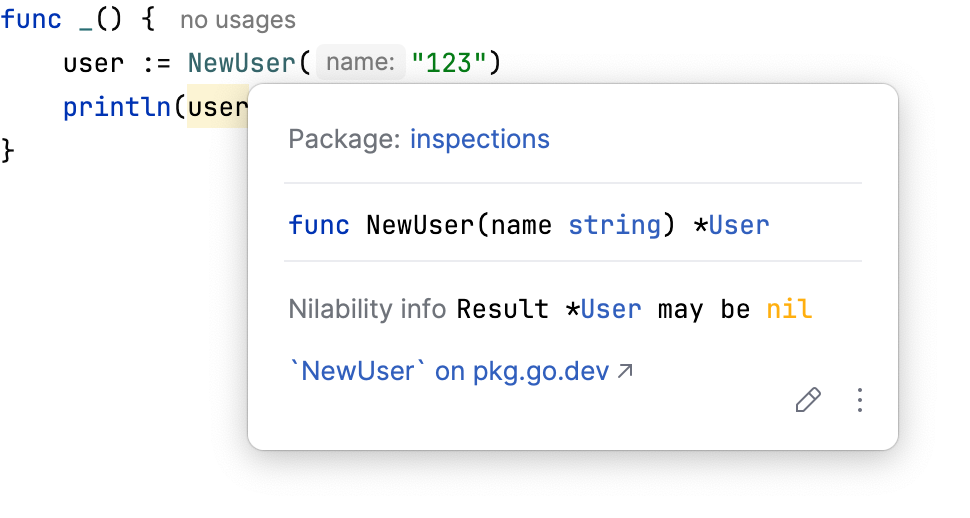
GoLand now includes nilability information directly in the quick documentation popup. This helps you quickly see if a function can return nil, or if it expects non-nil parameters or receivers.
Place the caret on a function, parameter, or receiver in your code.
Trigger the quick documentation popup by pressing Ctrl+Q. In the popup, look for the Nilability info section.
Resource leak analysis
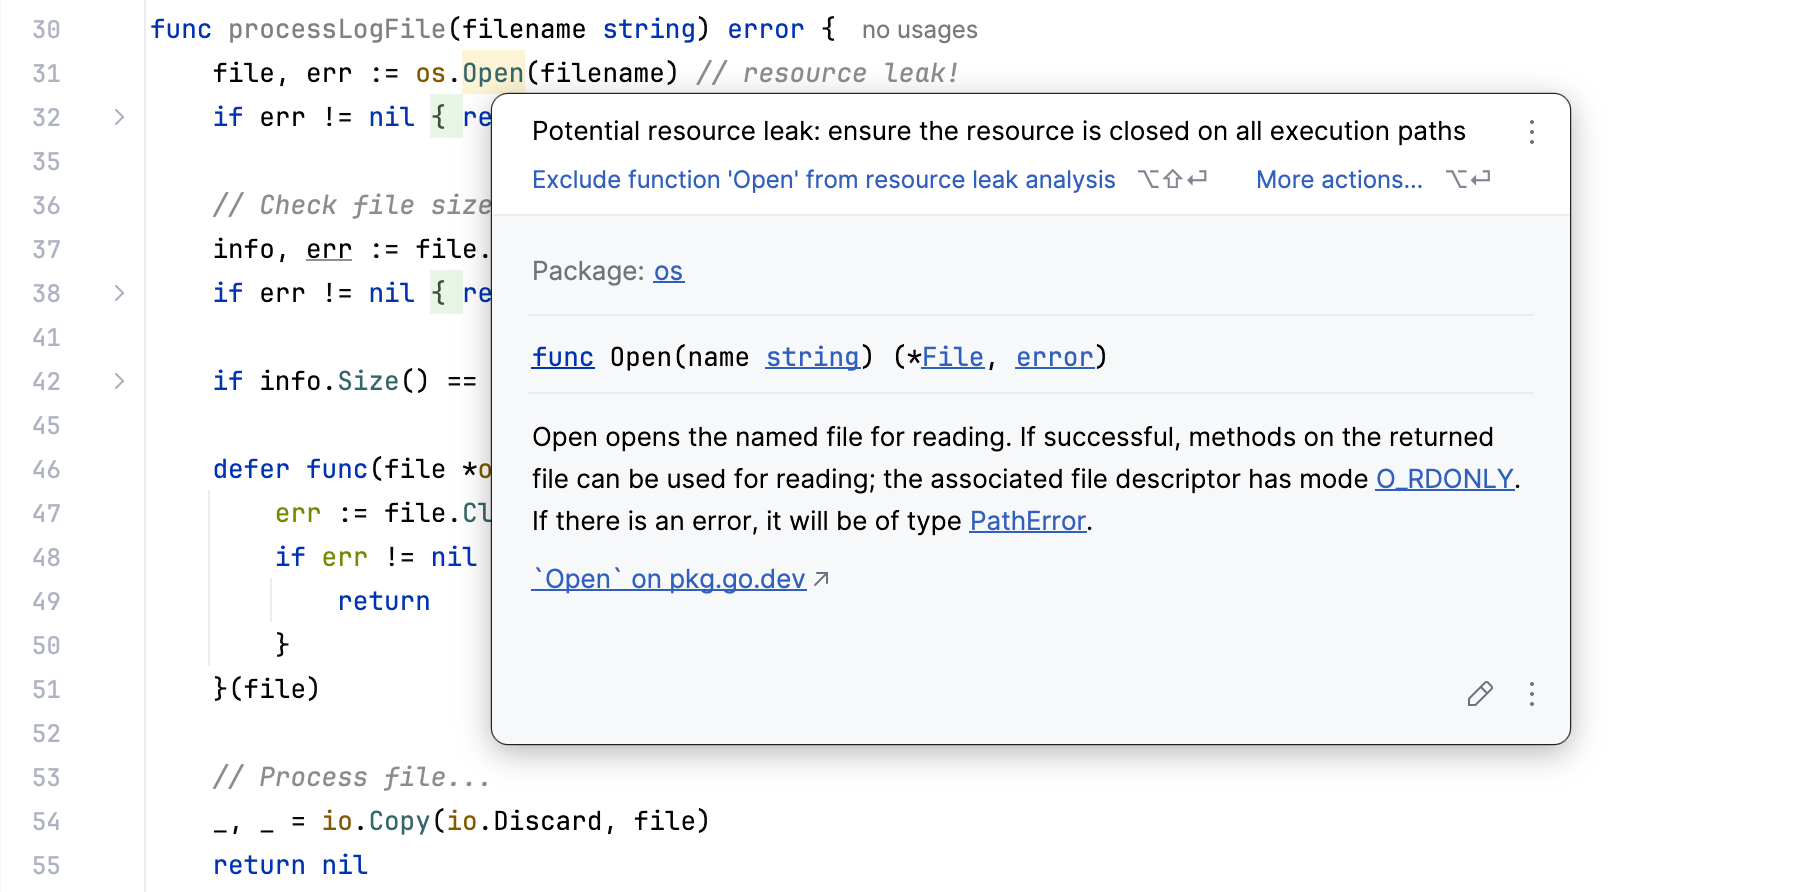
Resource leak analysis helps you identify resources, such as files or network connections, that were opened but not properly closed. In Go, such issues can lead to memory leaks, degraded performance, subtle bugs, and exhaustion of system resources, which may result in critical runtime errors.
In GoLand, this inspection analyzes your code locally to find potential resource leaks within a single function. It detects resources that implement the io.Closer interface and are returned from other functions.
How the analysis works
The inspection checks all control-flow paths in a function to ensure that resources are properly closed. If there is at least one path where a resource is not closed, GoLand highlights it with a warning about a potential resource leak.
For example:
The issue here is that we have early returns where the file is not closed.
When no warning appears
The inspection is designed to avoid false positives. It will not show a warning if a function transfers ownership of a resource — that is, if the resource is passed to another part of the program that may close it later. In these cases, GoLand considers the resource handled correctly.
No warning appears when the resource is:
Returned from the current function
Used in an anonymous function
Assigned to a global variable
Stored in a struct, slice, or map
For example, the following function will not trigger a warning:
Detecting leaks with reassignments
The inspection can also detect leaks caused by reassignments. For example:
Here, the resource returned by the first openFile() call is never closed, because the variable f is reassigned before Close() is called.
Code inspections with Qodana
Install the Qodana plugin
This functionality relies on the Qodana plugin, which you need to install and enable.
Press Ctrl+Alt+S to open settings and then select .
Open the Marketplace tab, find the Qodana plugin, and click Install (restart the IDE if prompted).
On top of running code inspections in your IDE, you can inspect your code using Qodana:
Run GoLand inspections locally, including your IDE, and as a part of CI/CD pipelines.
Run resource-consuming inspections using your CI/CD infrastructure.
Enforce quality standards with quality gates in your CI system.
Share the same inspection profile, both within the IDE and the CI tool.
Access inspections that are available only in Qodana, such as security checks and license audits.
Access historical overviews of inspection results.
You can compare inspection results between commits to better understand your progress.
For more information, refer to Qodana.
