User interface
Some of the main user interface elements of DataGrip are as follows:
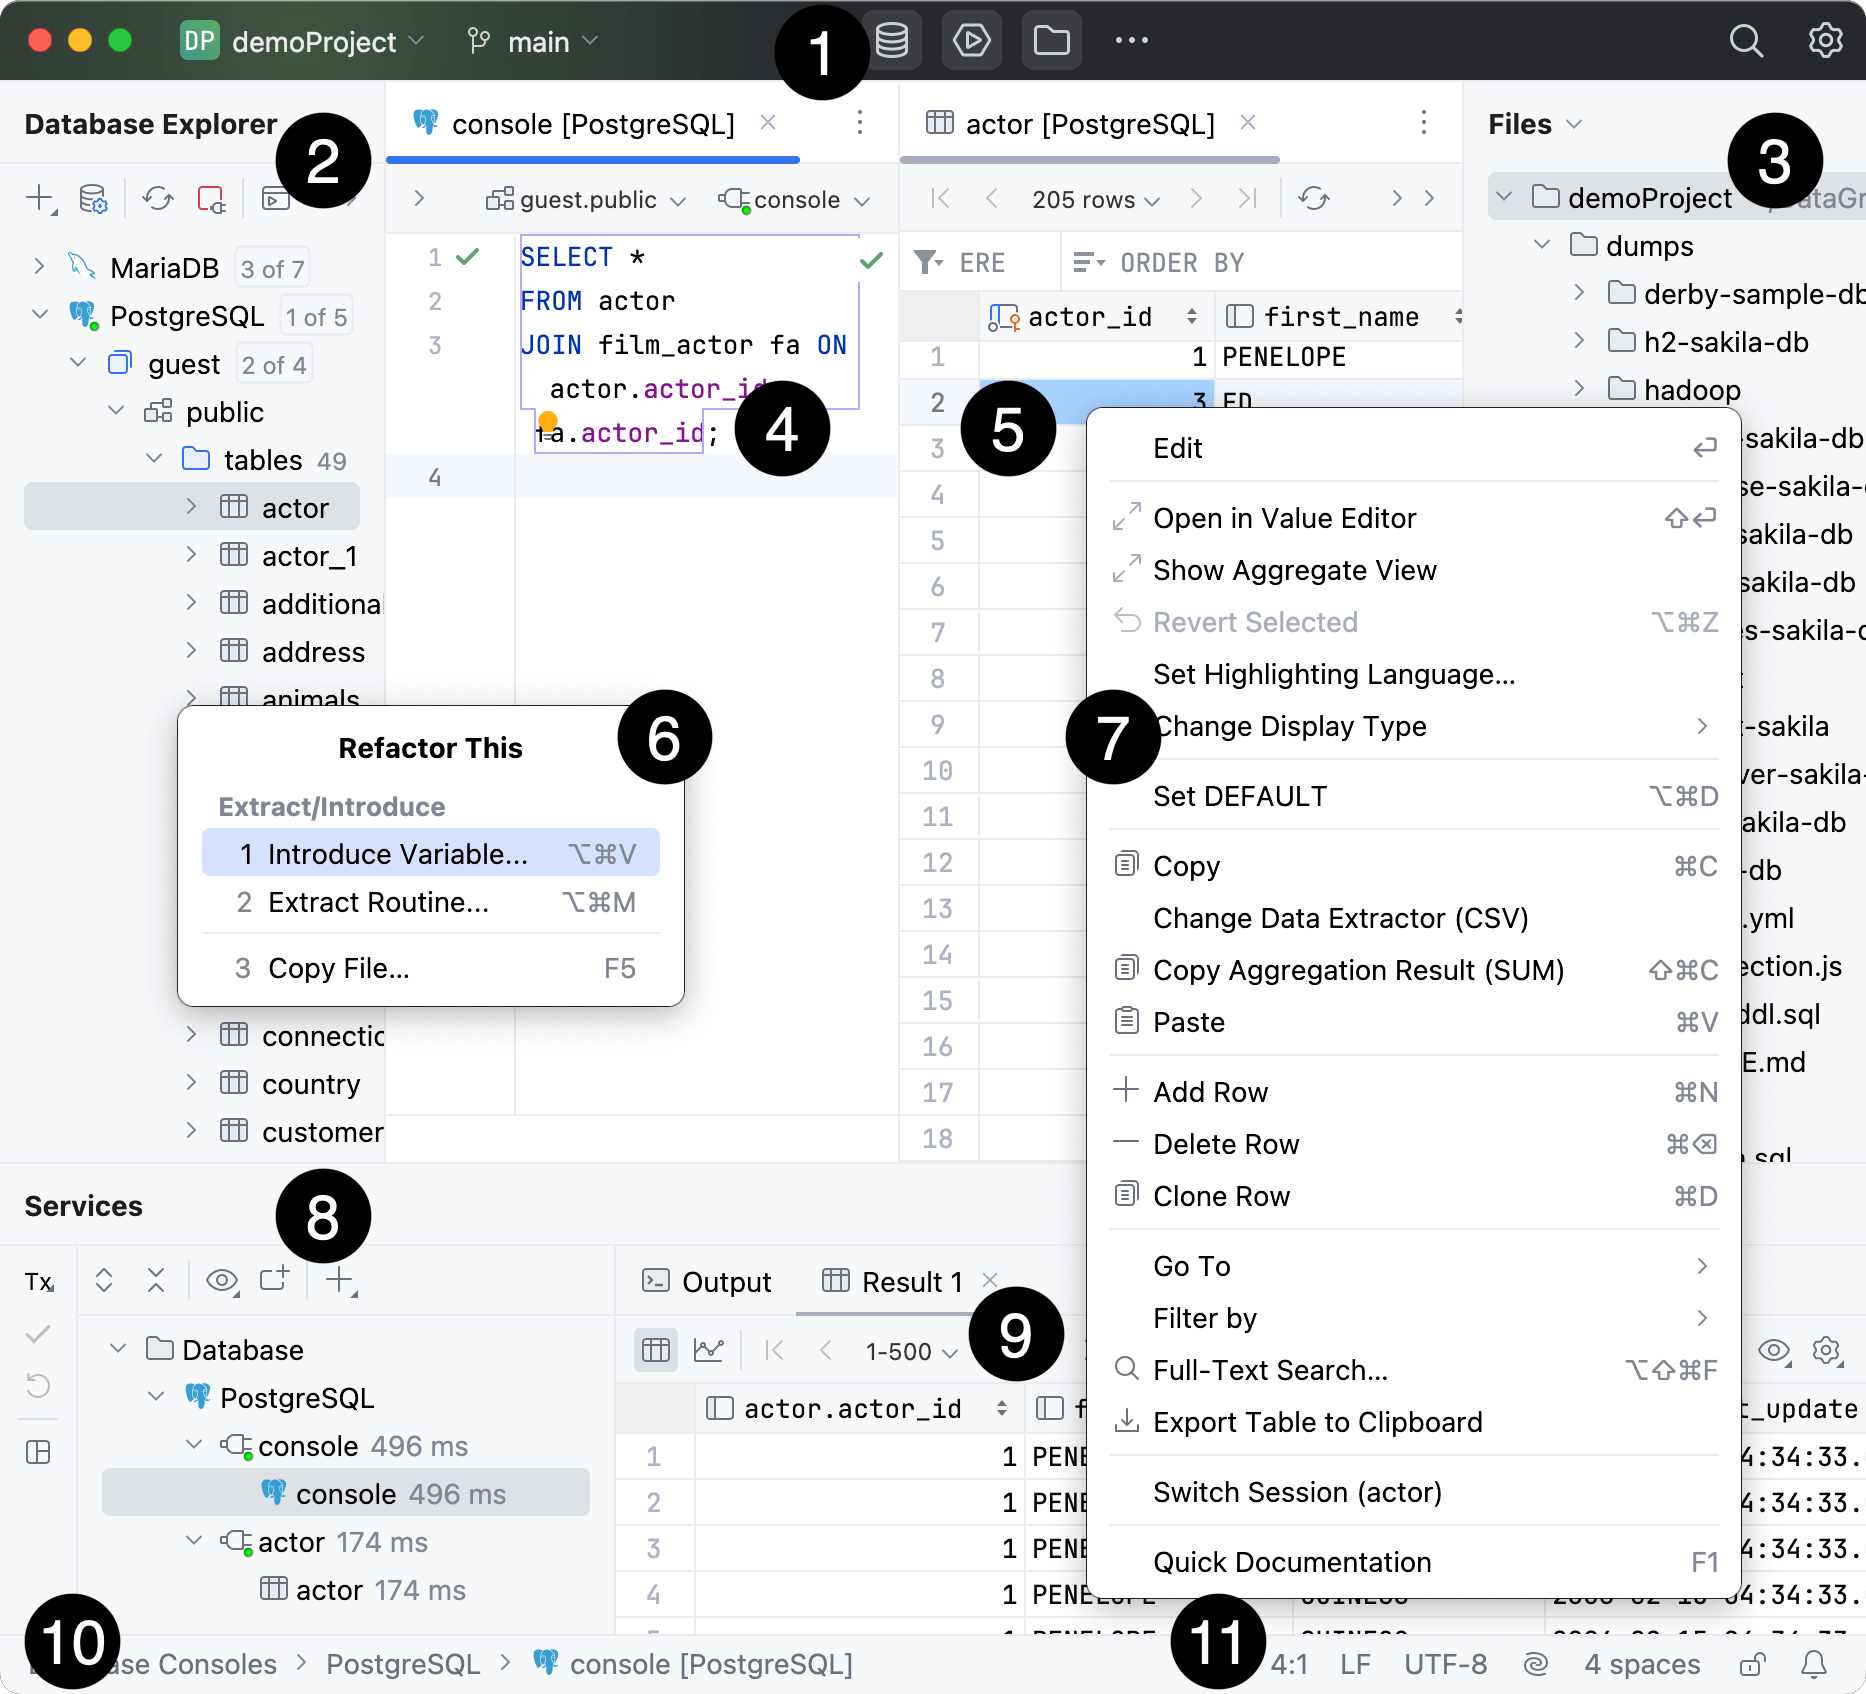
Database Explorer (tool window).
Files tool window.
Services tool window.
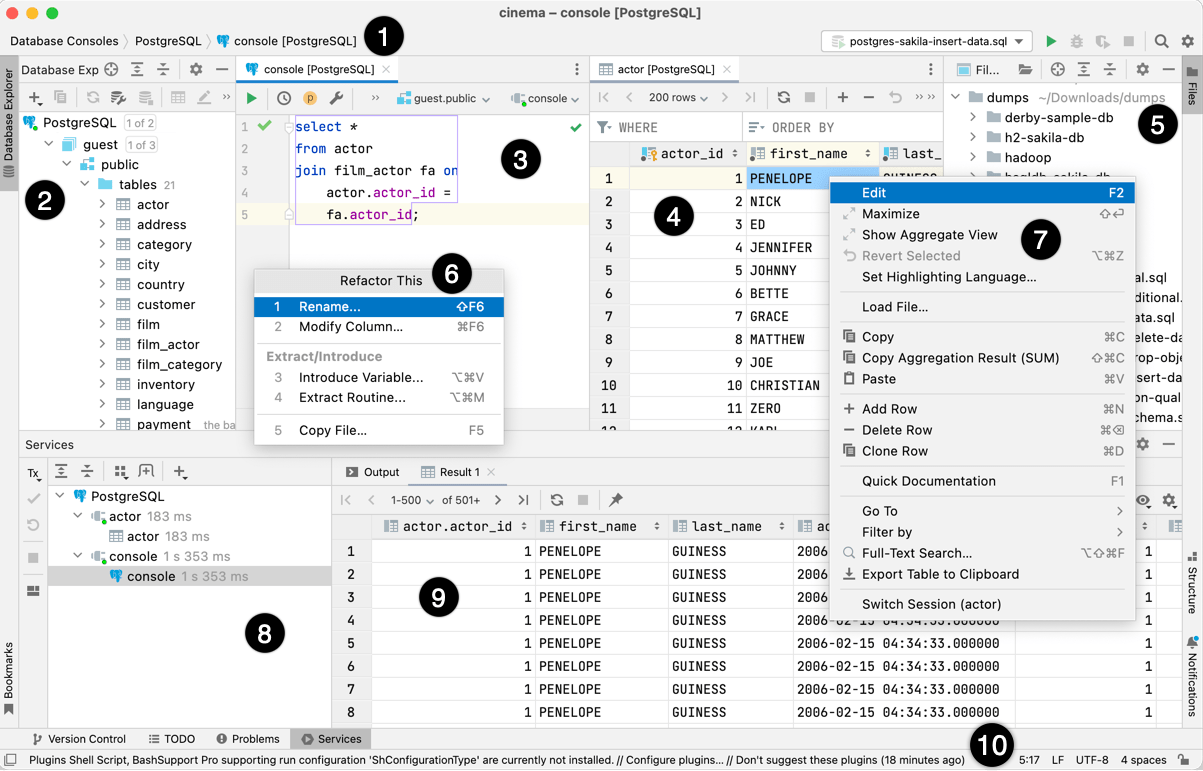
Database Explorer (tool window).
Files tool window.
Services tool window.
Depending on the set of plugins and configuration settings, your IDE may look and behave differently.
Action indicators and action list
Open the list of available actions: Alt+Enter
Various icons that appear in the gutter, for example, , help you notice quick-fixes and other actions. Clicking such action indicator or pressing Alt+Enter opens an action list with all quick-fixes and other actions that are available at the current caret position.
Main toolbar
Show/hide:
In DataGrip, main toolbar can contain the following: main menu (Windows and Linux only), project widget, tool window bar, VCS widget, run widget, and so on.
For more information about customizing the window header, refer to the Menus and toolbars topic.


Query console
Focus: Escape
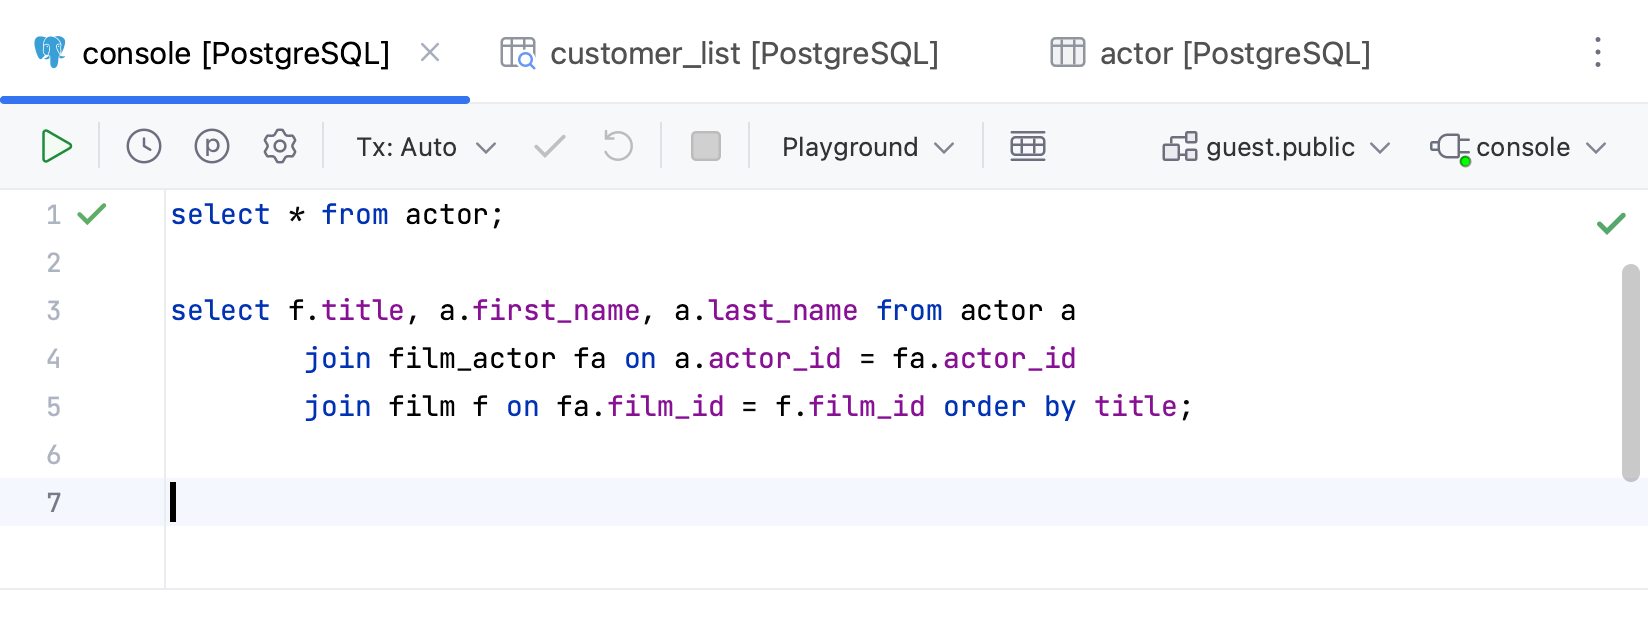
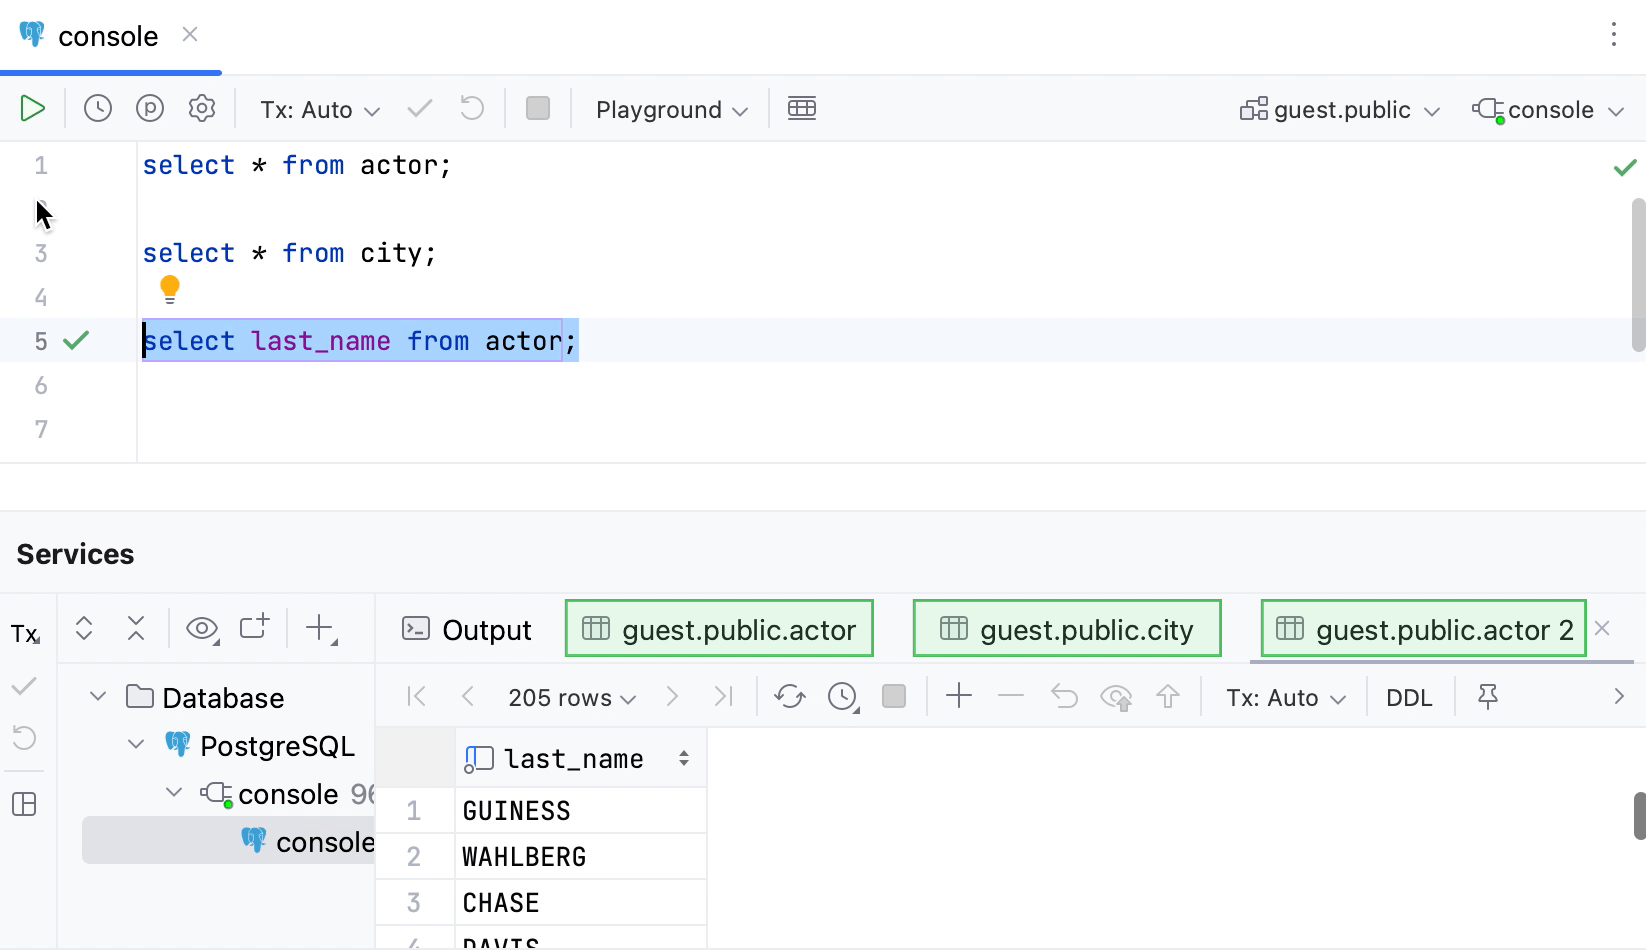
Use the query console to read, write, and run your SQL code.
Data editor and viewer
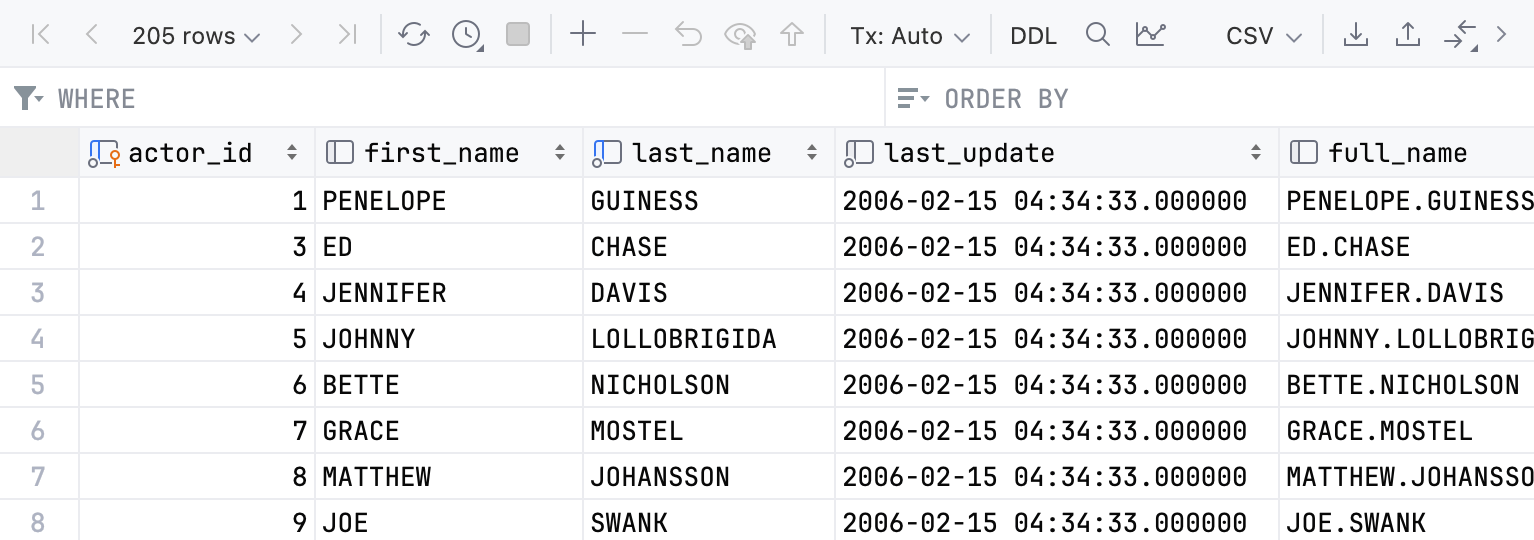
Use the data editor to sort, filter, add, edit, and remove the data of database objects, CSV files, and query results.
Query result tabs
View result sets of your queries in the Services tool window result tabs.
Navigation bar
Focus: Alt+Home
Show/hide:
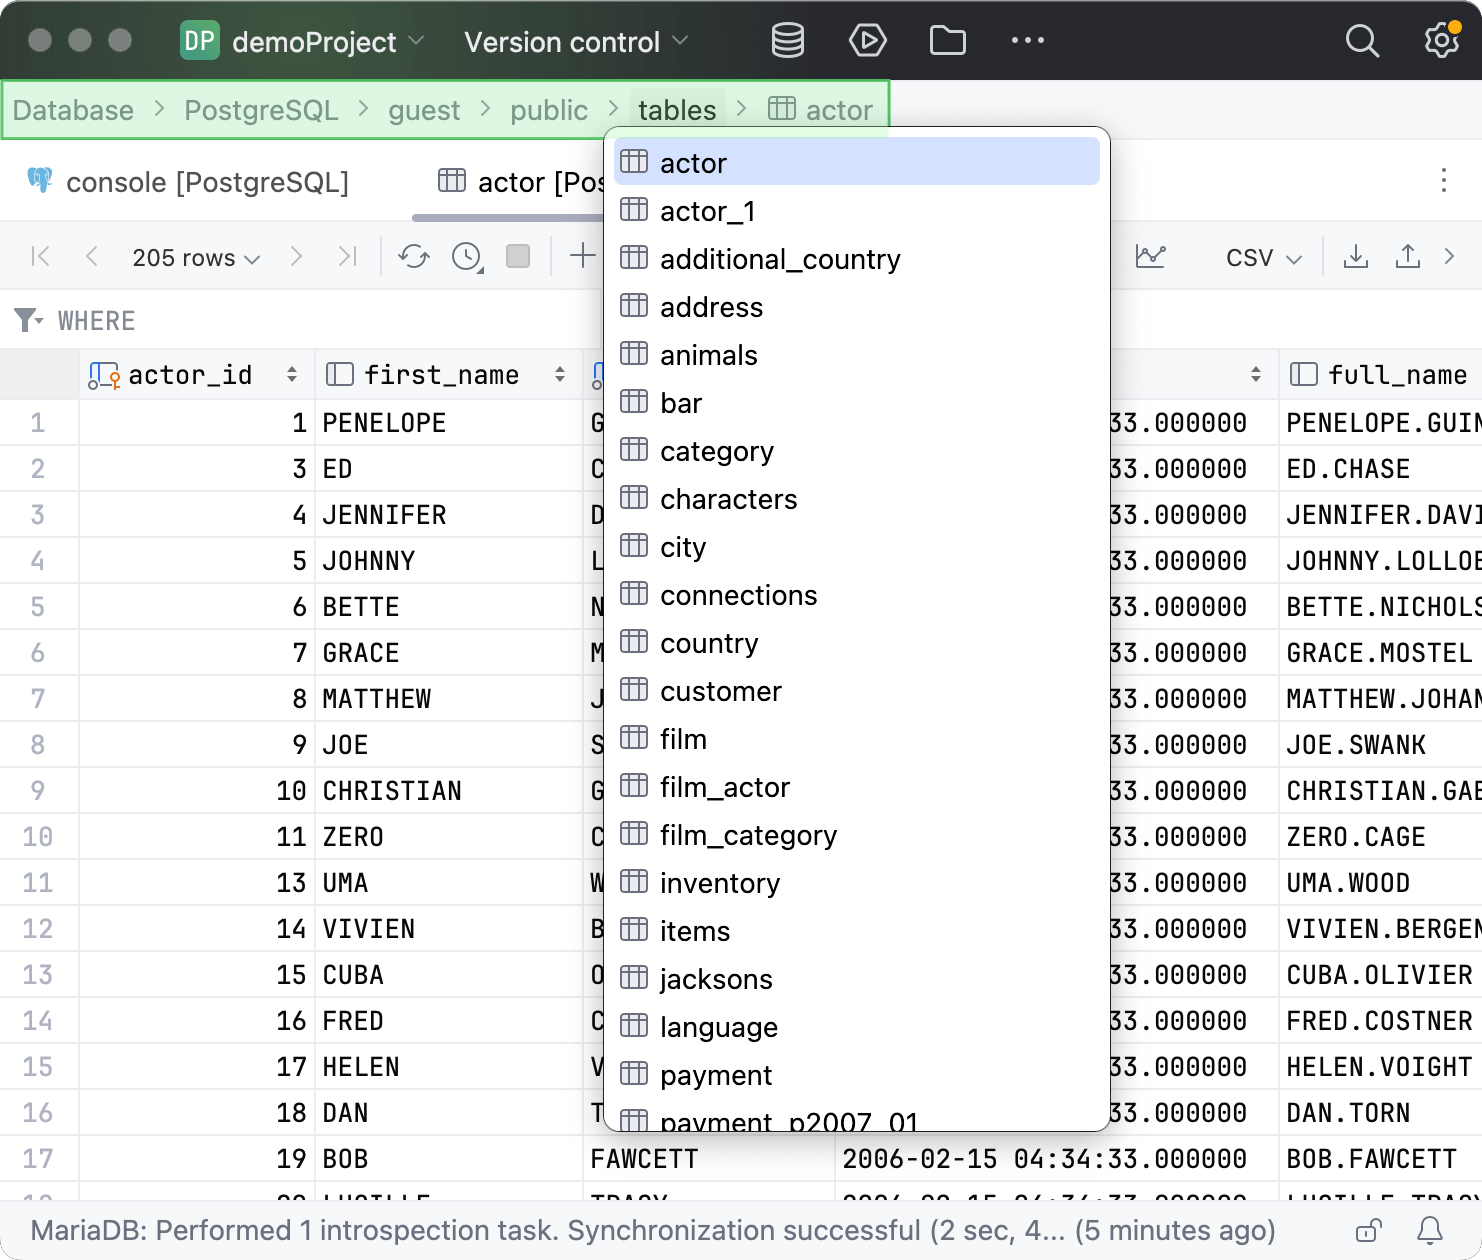
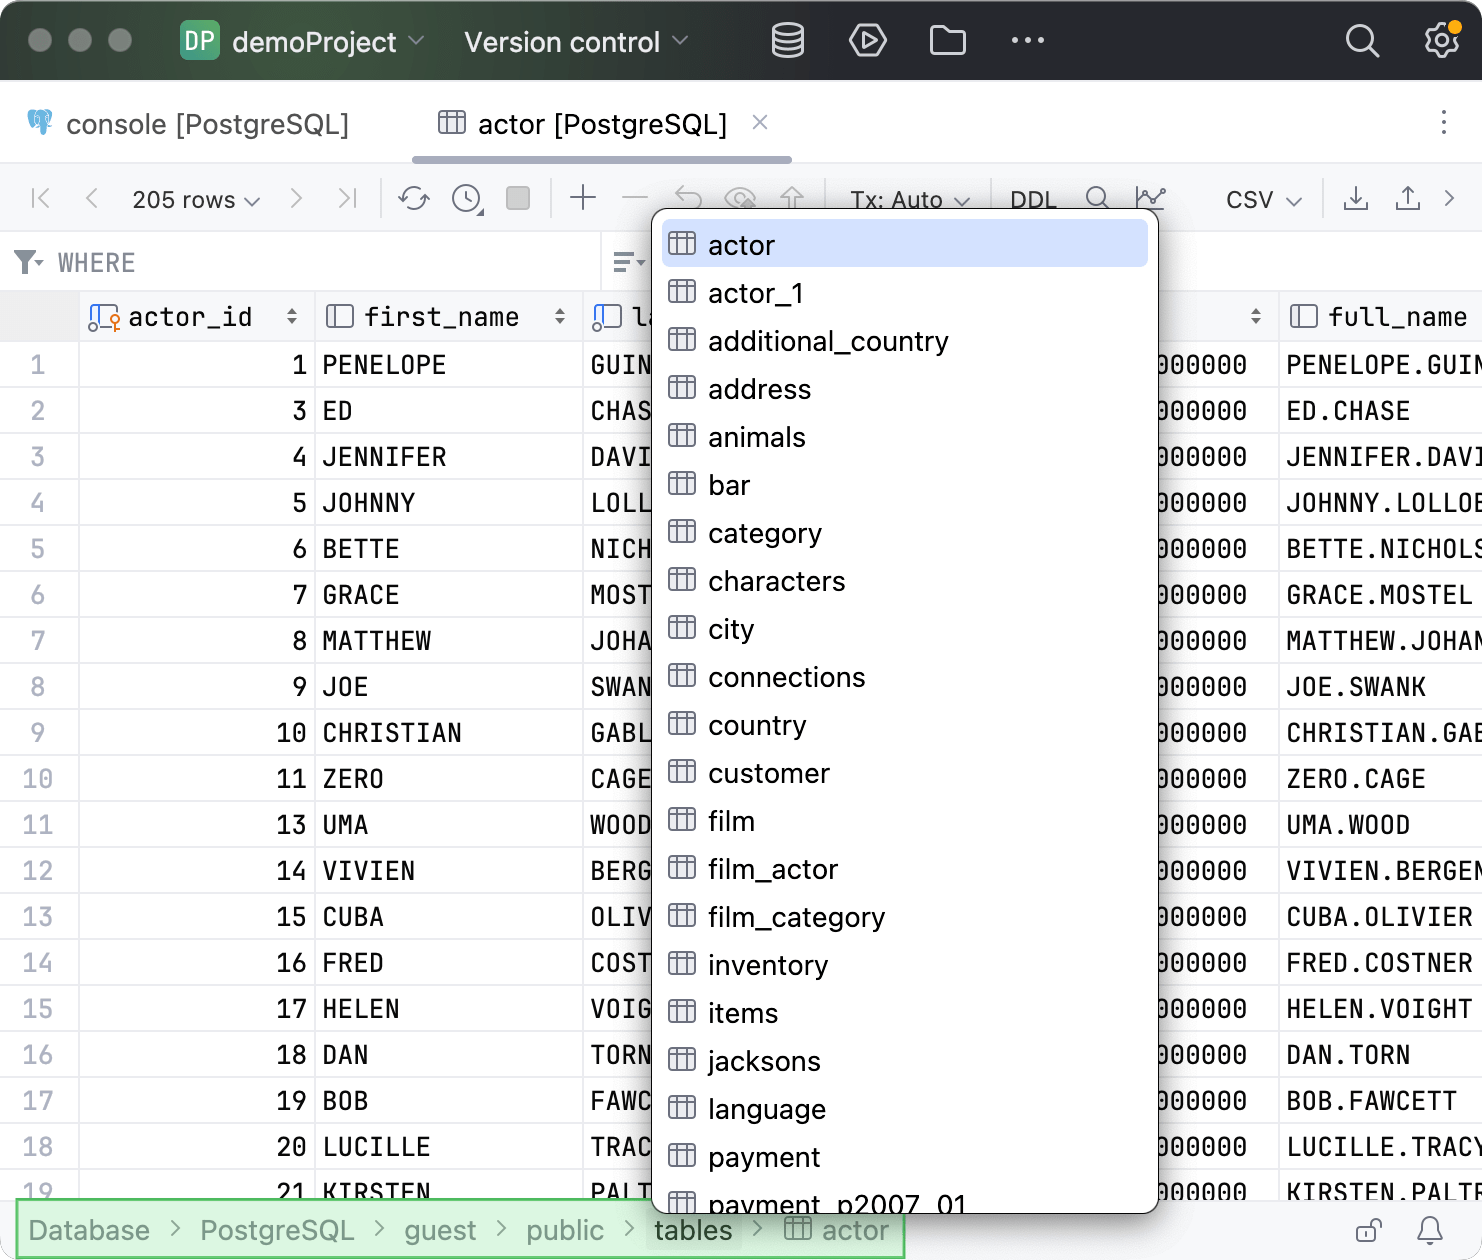
The navigation bar is a quick alternative to the Project view, where you can go through the structure of your database, open specific files, and jump to specific code elements in the current file.
Status bar
Show/hide:
The left part of the status bar at the bottom of the main window shows the most recent event messages and descriptions of actions when you hover over them with the mouse pointer. Click a message in the status bar to open it in the Notifications tool window. Right-click the message in the status bar and select Copy to paste the message text when you are searching for a solution to a problem or need to add it to a support ticket or to the DataGrip issue tracker.
The status bar also shows the progress of background tasks. You can click to show the Background Tasks manager.
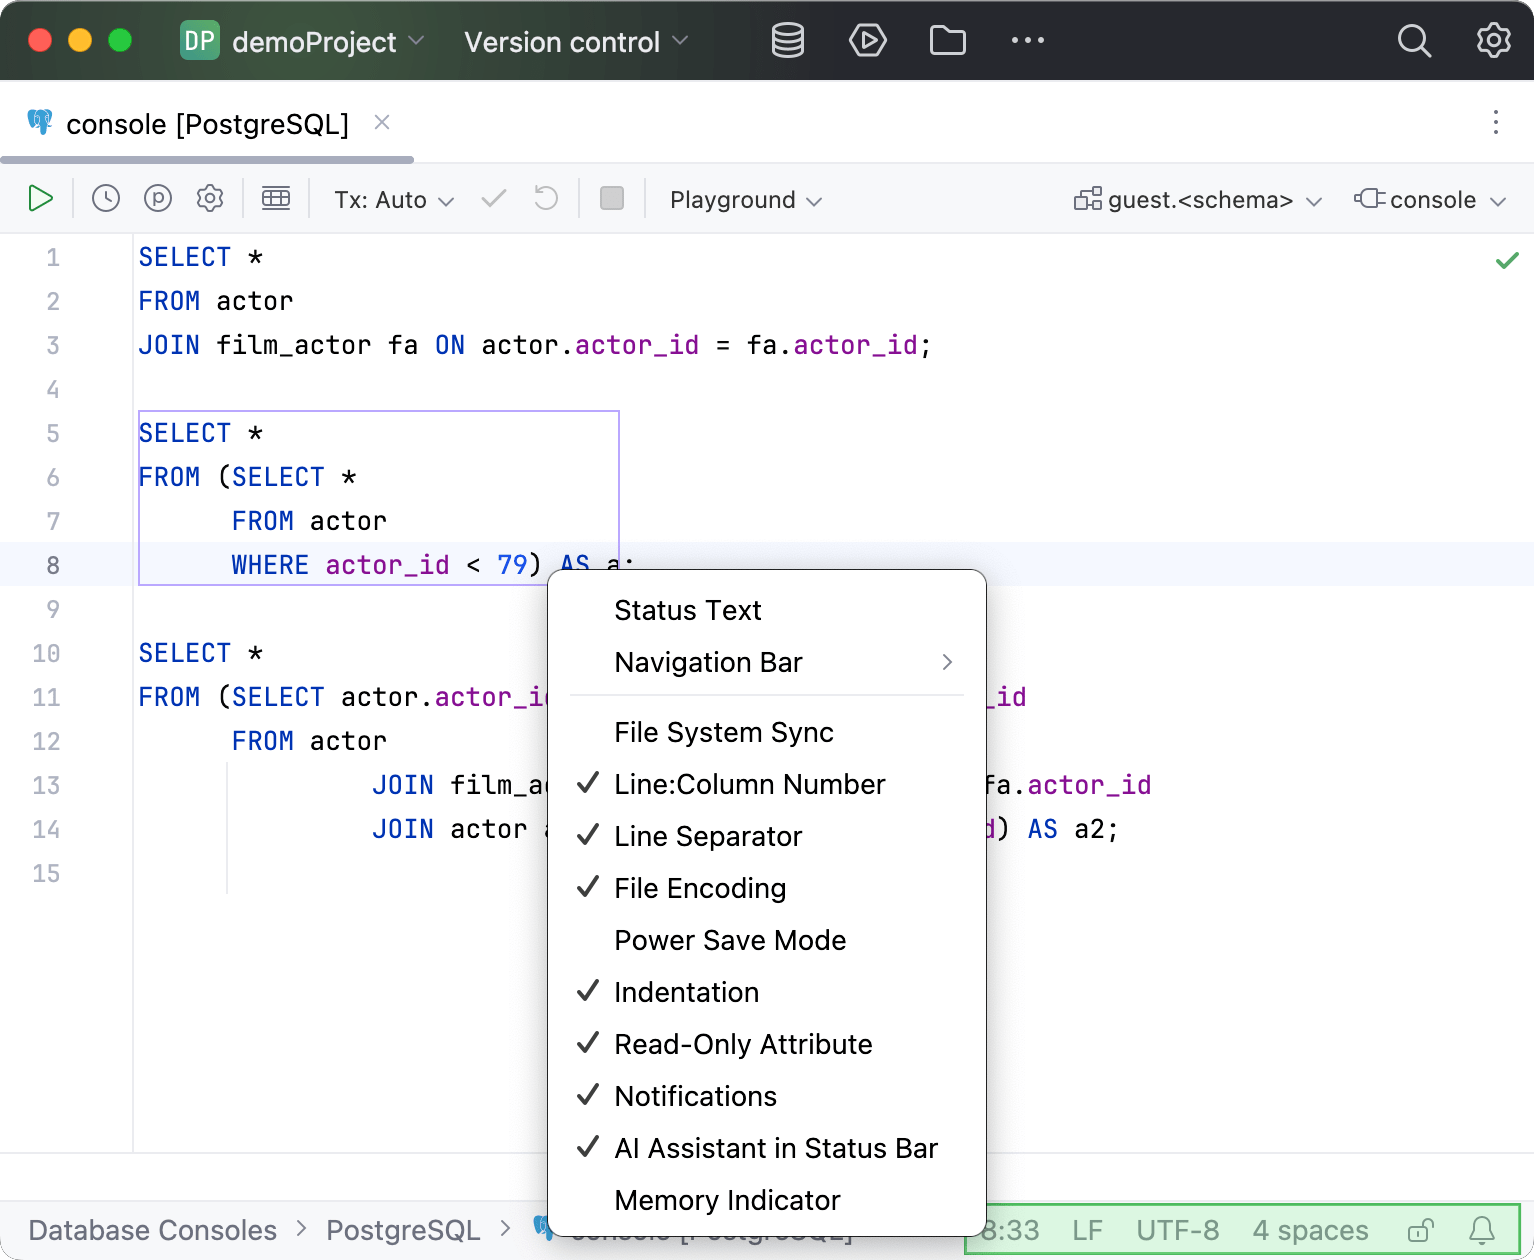
The right part of the status bar contains widgets that indicate the overall project and IDE status and provide access to various settings. Depending on the set of plugins and configuration settings, the set of widgets can change. Right-click the status bar to select the widgets that you want to show or hide.
The blinking in the corner indicates that internal IDE errors have occurred. Click to view the error descriptions and submit reports.
Widget | Description |
|---|---|
Status Text | Shows the most recent event messages and descriptions of actions when you hover over them with the mouse pointer. Click a message in the status bar to open it in the Notifications tool window. Right-click the message in the status bar and select Copy to paste the message text when you are searching for a solution to a problem or need to add it to a support ticket or to the DataGrip issue tracker. |
Line:Column Number | Shows the line and column number of the current caret position in the editor. Click the numbers to move the caret to a specific line and column. If you select a code fragment in the editor, DataGrip also shows the number of characters and line breaks in the selected fragment. |
Line Separator | Shows the line endings used to break lines in the current file. Click this widget to change the line separators. |
File Encoding | Shows the encoding used to view the current file. Click the widget to use another encoding. |
Column | Indicates that the column selection mode is enabled for the current editor tab. You can press Alt+Shift+Insert to toggle it. |
Read-Only Attribute | Click to lock the file from editing (set it to read-only) or unlock it if you want to edit the file. |
Git Branch | If version control integration is enabled, this widget shows the current VCS branch. Click it to manage VCS branches. |
Indentation | Shows the indent style used in the current file. Click to configure the tab and indent settings for the current file type or disable indent detection in the current project. |
Memory Indicator | Shows the amount of memory that DataGrip consumes out of the total amount of heap memory. For more information, refer to Increase the memory heap of the IDE. |
Notifications | Opens the Notifications tool window. The indicator next to the icon marks new notifications and their importance: a blue dot marks regular events and unimportant suggestions. A red dot marks errors and important suggestions. |
Tool windows
Show/hide:
Tool windows provide functionality that supplements editing code. For example, the Database Explorer shows you the structure of your database, and the Services tool window displays the output of your SQL code when you run it.
By default, tool windows are docked to the sides and bottom of the main window. You can arrange them as necessary, undock, resize, hide, and so on. Right-click the title of the tool window or click in the title for its arrangement options.
You can assign shortcuts to quickly access the tool windows that you frequently use. Some of them have shortcuts by default. For example, to open the Database Explorer, press Command 1, and to open the Services tool window, press Alt+8. To jump from the editor to the last active tool window, press F12.
Context menus
You can right-click various elements of the interface to see the actions available in the current context. For example, right-click a database object in the Database Explorer for actions related to that database object, or right-click in the query console to see actions that apply to the current code fragment.
Most of these actions can also be performed from the main menu at the top of the screen or the main window. Actions with shortcuts show the shortcut next to the action name.
Popup menus
Popup menus provide quick access for actions related to the current context. Here are some useful popup menus and their shortcuts:
Alt+Insert opens the Generate popup for generating boilerplate code based on the context.
Control+Alt+Shift+T opens the Refactor This popup with a list of contextually available refactorings.
Alt+` opens the VCS Operations popup with contextually available actions for your version control system.
You can create custom popup menus using quick lists of actions that you often use.