Run applications
CLion enables running entire applications as well as unit tests.
If you have configured Before launch tools in a Run/Debug configuration, CLion runs them first, and then will run the application. Otherwise, the program will start immediately.
Quick way
Run from the editor
If you are not going to pass any parameters to your program, and your program does not require any specific actions to be performed before start, you can run it right from the editor.
Click
in the gutter near the class declaration and select Run.

Customizable way
If you are going to pass parameters to your program or otherwise customize the startup of your program, use a run/debug configuration.
Create/edit a configuration
Go to . Alternatively, press Alt+Shift+F10, then 0.
Edit one of the existing configurations or click
to create a new one.

Run a configuration
Use one of the options:
Click Run in the Edit Configuration dialog to save the settings and run the configuration right-away:

Select the configuration in the toolbar switcher and click the
icon next to it:

Alternatively, after you selected the configuration, click the Run button on the main toolbar or press Shift+F10:

When the application starts, you can view its output and interact with it in the Run tool window. Every run/debug configuration creates a separate tab when you run it.

For more information about tool windows and how to manage them, see the Tool windows topic.
Re-run applications
On the toolbar of the Run tool window, click
or press Shift+F10.
Stop and pause applications
When you stop a program, its process is interrupted and exits immediately. When you pause a program, it continues running in the background, but its output is suspended.
Stop a program
In the Run tool window, click
on the toolbar. Alternatively, press Ctrl+F2 and select the process to stop.
Pause the program output
Right-click in the Run tool window and select Pause Output from the context menu. Use the same toggle to resume the program.
Show running processes
You can view the list of all active run or debug sessions and navigate between them.
Go to Run | Show Running List. In the top-right corner of the editor, CLion shows a list with all active applications.

CPU and Memory Live Charts
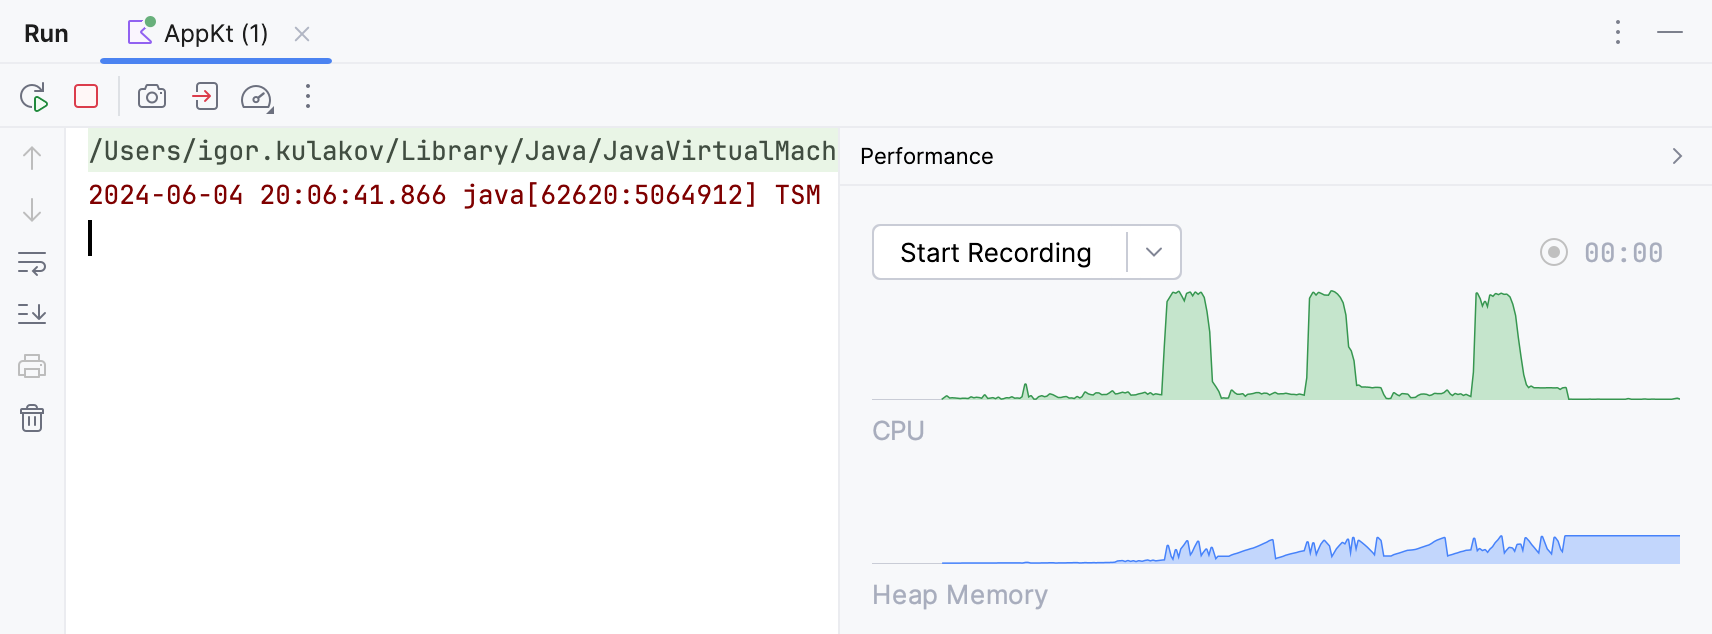
CLion provides a way to monitor live performance statistics for a running process through CPU and Memory Live Charts.
As opposed to viewing static figures, live data may help you to visualize resource consumption, identify resource-related bottlenecks, and understand how certain events affect the program performance.
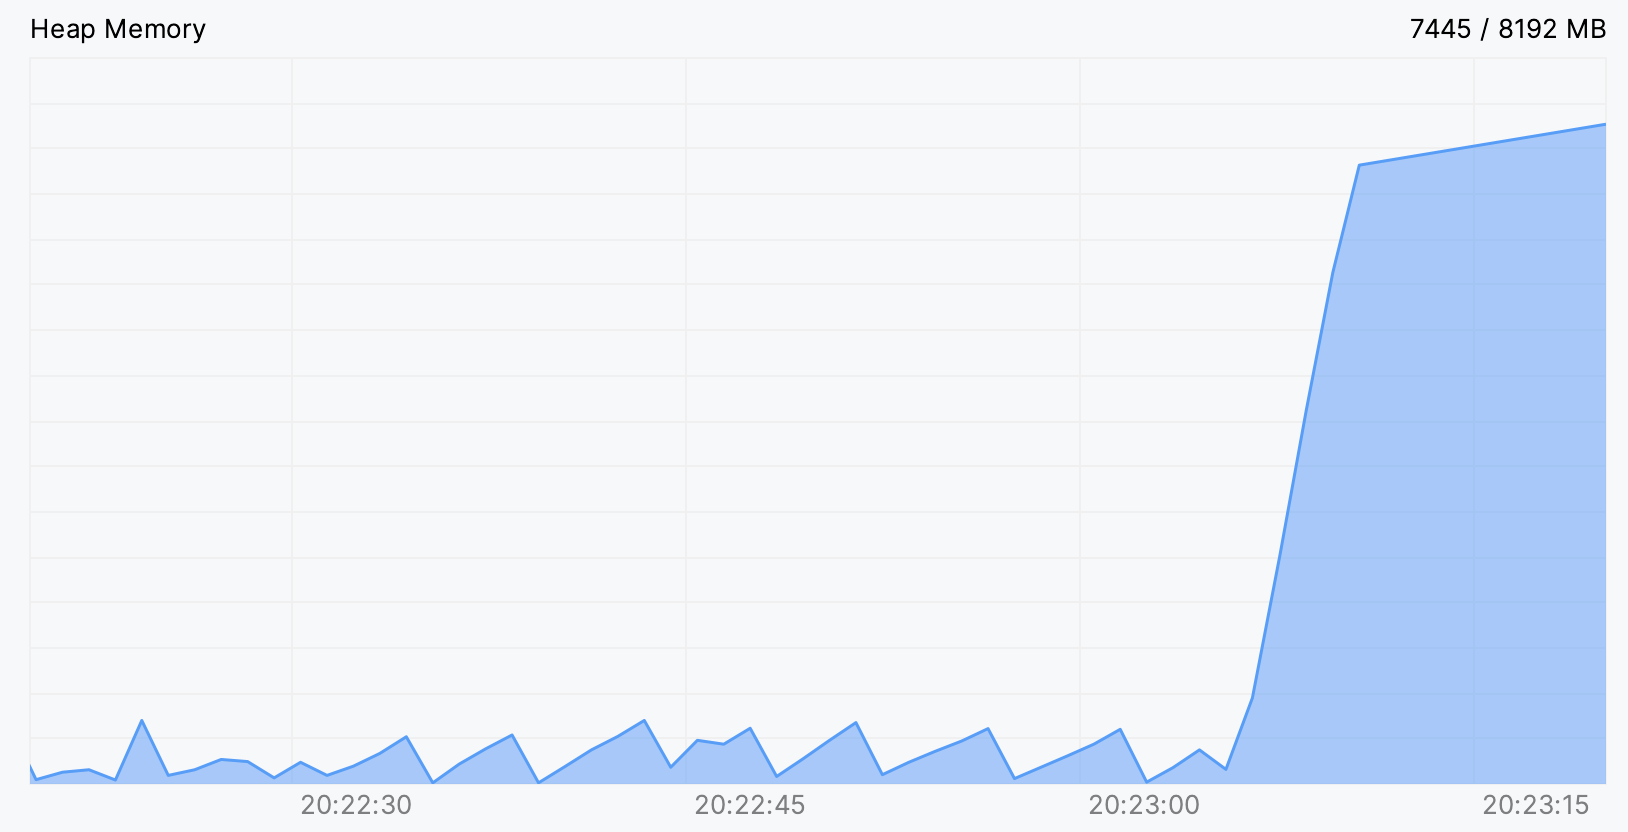
For example, in the picture below, we can see what a memory leak looks like in the Heap Memory chart. Sometimes it is enough to figure out the cause, and when it is not enough, it can give a clue for further investigation.

CPU and Memory Live Charts are automatically shown for all programs that you run from CLion:

For more information, refer to Monitor resources usage.