Watchpoints
Watchpoints (sometimes referred to as data breakpoints) are helpful when you need to focus on a particular variable and its behaviour throughout the program execution. Whenever your program accesses the breakpoint being watched, CLion will pause the execution or log to the console.
Set up a watchpoint
Pick a variable or expression , right-click it and choose Add Watchpoint:

Configure the watchpoint in the popup:

To access additional properties, click More Ctrl+Shift+F8 or select from the main menu:

Option
Description
Enabled
Select or clear this checkbox to enable or disable the watchpoint.
Suspend
If this option is selected, the program's execution will stop at the event specified in the Access Type field. If you clear this checkbox, the program will not stop at the watchpoint hit, but any associated actions (e.g., logging) will still be performed.
Log to console
Select these checkboxes to log the Breakpoint hit message or the watchpoint's stack trace to console. This is useful if you want to analyze the changes of a variable without stopping the program's execution.
Remove once hit
Set this option to ensure that the watchpoint is removed after being hit once. This is helpful when you need to find the first occurrence of a watchpoint event.
Disable until breakpoint is hit
This option disables the current watchpoint until some other breakpoint is encountered.
Access Type
Choose the type of access that will trigger the watchpoint: Read, Write, or Any.
Using a watchpoint in debugging
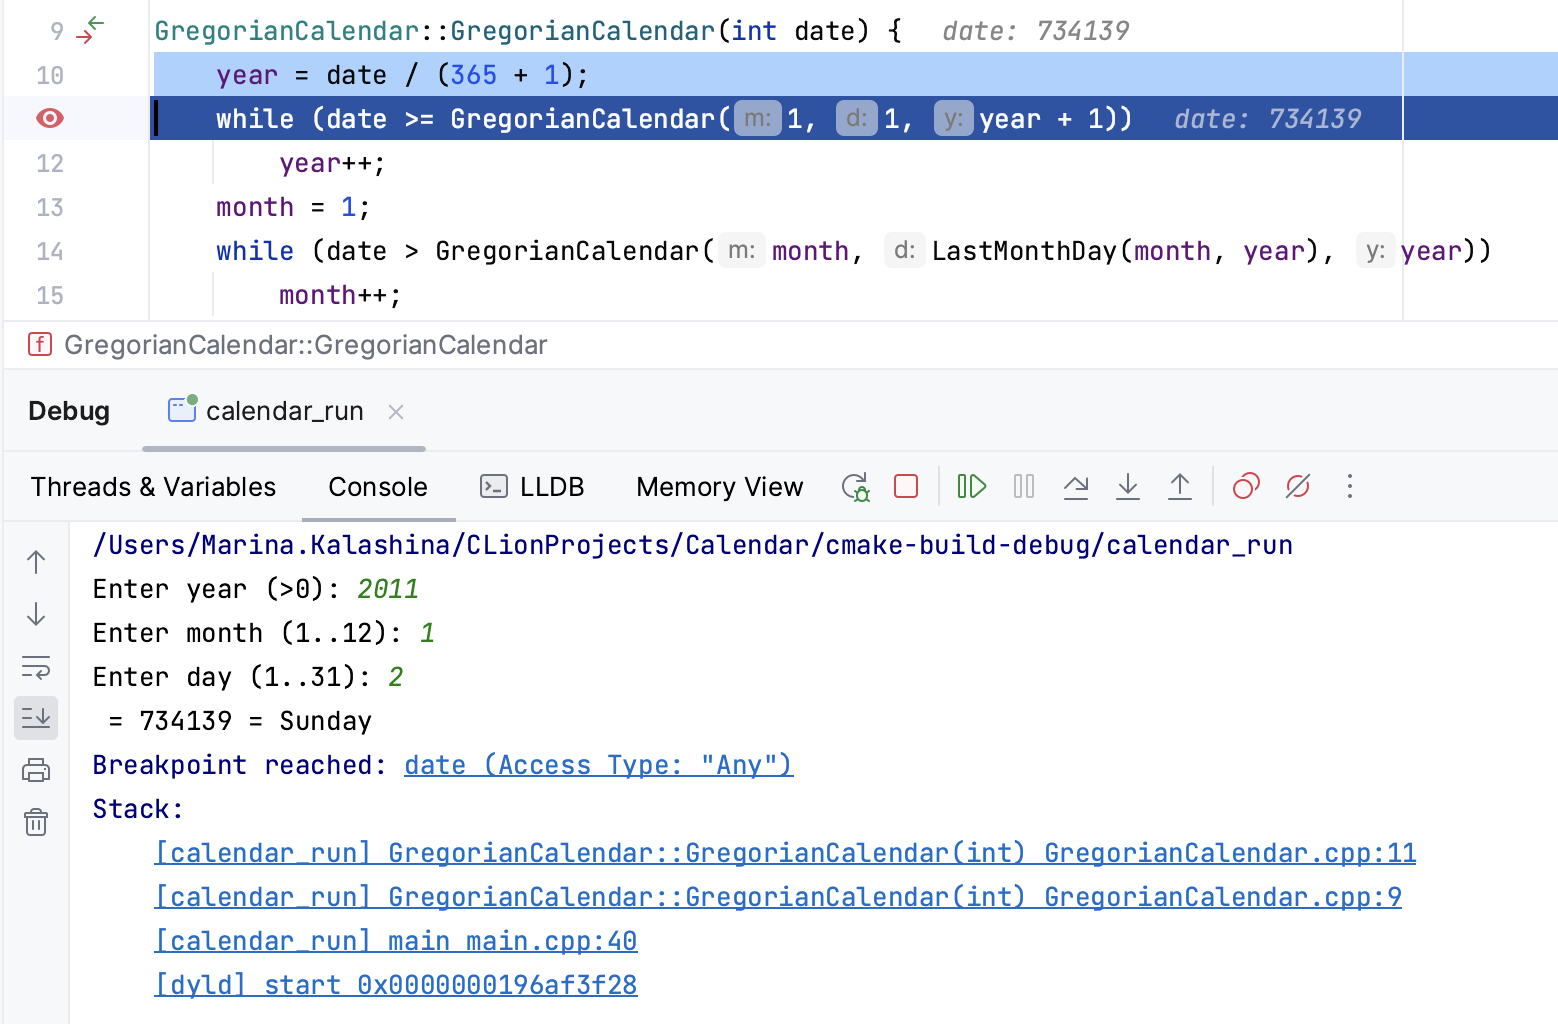
With a watchpoint set and configured, you can resume debugging to monitor accesses to the chosen variable. If suspending is enabled, the program stops when the watchpoint is hit, and CLion highlights the corresponding code line. If logging to console is enabled as well, the output is shown in the Console tab:

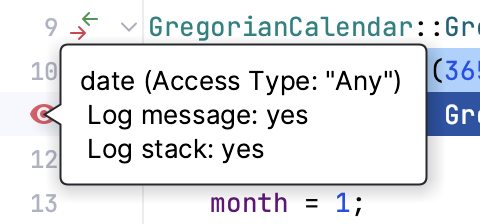
The watchpoint's icon is different from the icon of a regular breakpoint (there is an 'eye' on it). Hover over it to view the popup message with details of the current watchpoint hit:

Now you have the variable behaviour isolated from the rest of the program flow. You can remove the watchpoint and use stepping techniques or create more breakpoints to analyze the actual cause of the problem.