Coding assistance
Smart completion
The IDE helps you write new code by auto-completing statements for you. Ctrl+Shift+Space gives you a list of the most relevant symbols applicable in the current context. When you choose a suggestion, it adds corresponding package import statements on the fly.
Inspections & quick-fixes
The IDE provides built-in inspections that check your code on the fly as you type it. When they find problematic code, they provide you with quick-fixes which you can apply simply by pressing Alt+Enter.
Refactorings
The available refactorings include Rename and Extract, allowing you quickly and safely change your code.
Quick navigation
It only takes one click to switch to a super method, implementation, usages, declaration, and more. Jump to any class, file or symbol, or even any IDE action or tool window in one click.
Quick popups
When you need more information about a symbol at the caret, use quick popups: e.g. Quick Documentation, Quick Definition, Show usages, Structure, etc.
Some popups are available even when you use code completion: they provide additional information about selected suggestion.

Code generation
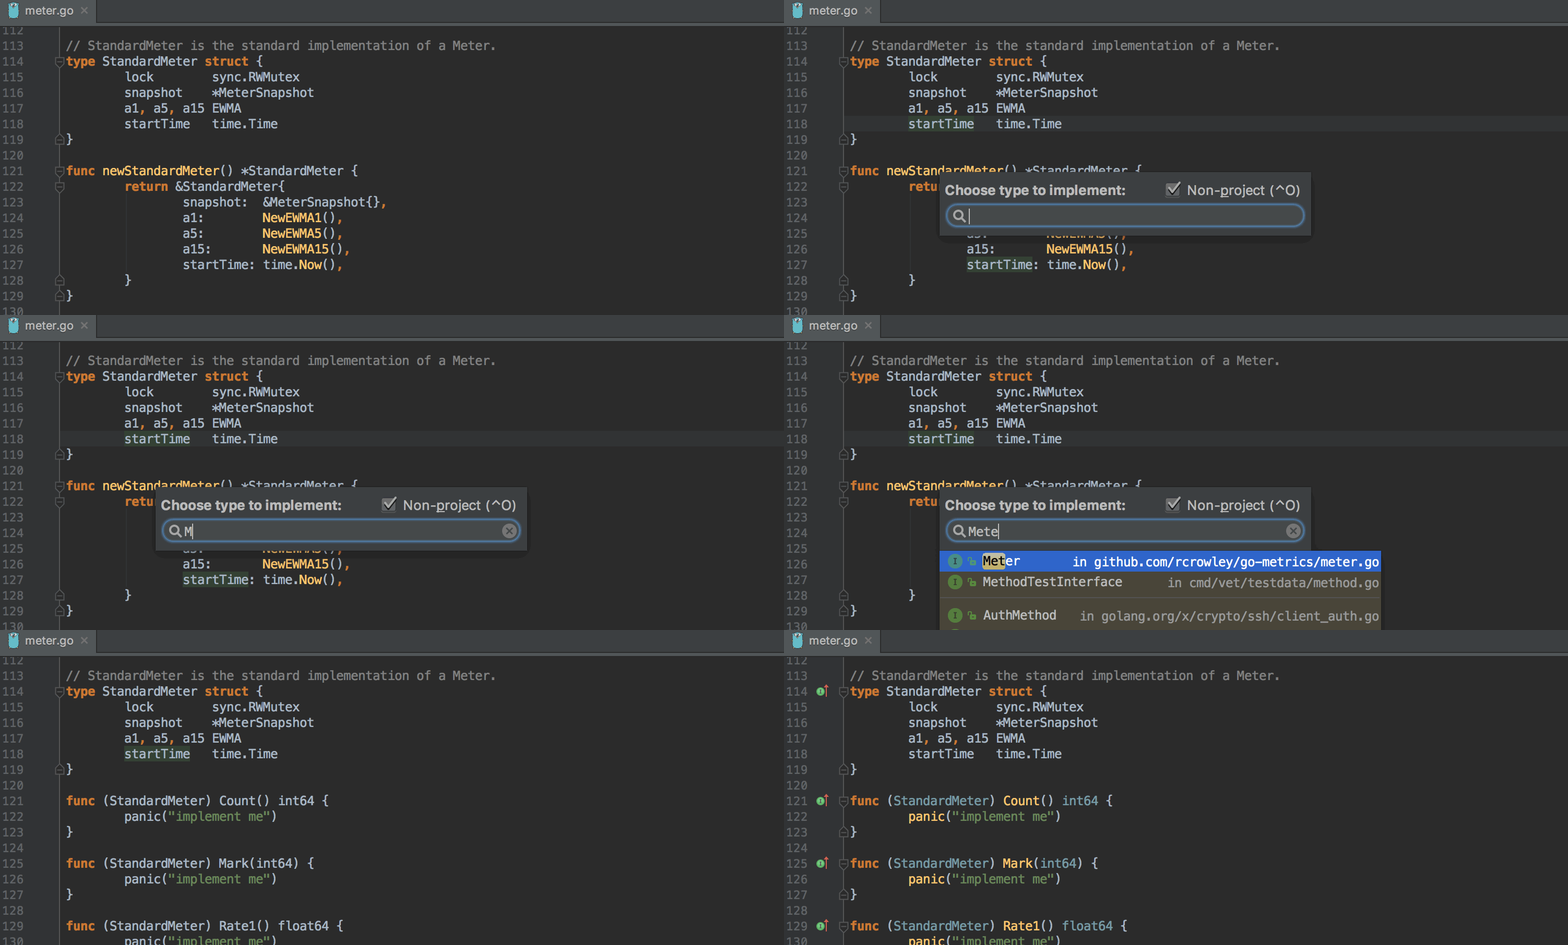
In some cases the IDE can generate trivial code for you. For example, if you click Ctrl+O, the IDE will help you implement any interface by generating its methods.

Detecting recursive calls
If you have a recursive call inside your function, the IDE will detect it and mark it on the gutter, making your code even easier to read and understand.

Type Parameter
The Type Parameter action is available via Alt+ and is always at hand when you need to know the type of any expression at the caret.

Exit points highlighting
Every function may have more than one return and panic statements. To quickly find them all, press Ctrl+Shift+F7 when the caret is at a func, return, or panic keyword. This helps you understand more quickly how a function works.

Finding usages
The Find Usages feature may not only find all places in the code where a symbol is used, but also group these usages by type: e.g. reading, writing, etc.

Formatter
The built-in formatter provides the functionality equal to go fmt.
Code editor

Semantic highlighting
This option extends the standard syntax highlighting with unique colors for each parameter and local variable.

Parameter hints
The editor shows parameter hints for literals and nils used as method arguments. These hints make code much more readable.
Built-in tools and integrations
Debugger
The IDE comes with a full-featured debugger that supports common debugger features: Watches, Evaluate Expression, Show Inline Values, and others. The debugger works for applications as well as for tests.
Coverage
If you run your code with a coverage instruction, the IDE collects the data and displays it in both the aggregated view and per statement in the Editor.

Test runner
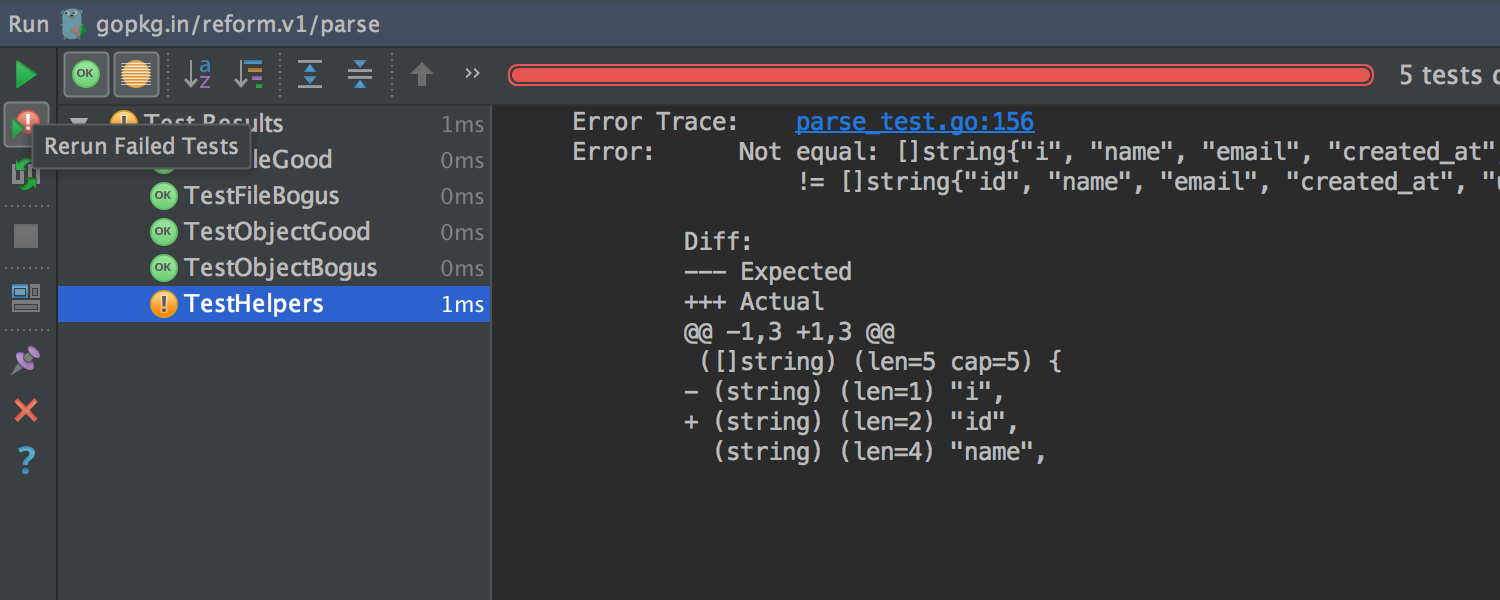
The IDE provides a dedicated interface for running and debugging tests, benchmarks and checks.

Go tools
The Code → Go Tools menu allows you to run Go tools on your project without switching to the command line.

Plan9
The Editor provides syntax highlighting for Go assembly files.

Version control
The built-in Git integration lets you browse the history of changes, manage branches, merge conflicts and much more. For other version control system, similar functionality is available via corresponding plugins: Mercurial, SVN, and others.

Terminal
The IDE comes with a built-in terminal. Depending on your platform, you can work with command line prompt, Far, powershell, or bash. Invoke the terminal with Alt+F12 and execute any command–without leaving the IDE.

Docker
The IDE offers a plugin that lets you connect to locally running Docker machines to manage images, containers and Docker Compose services.
Front-end and back-end development

JavaScript, HTML and CSS
The IDE inherits from WebStorm its first-class support for front-end languages and frameworks. The IDE offers top-notch coding assistance for JavaScript, TypeScript, Dart, React and many others. The support for Angular and Node.js is available via plugins.

Database tools
Take advantage of intelligent coding assistance when editing SQL; connect to live databases; run queries; browse and export data; and even manage your schemes in a visual interface–right from the IDE.
Plugin ecosystem
More than 10 years of IntelliJ platform development gives GoLand 50+ IDE plugins of different nature, including support for additional VCS, integrations with different tools and frameworks, and editor enhancements such as Vim emulation.


Tell me about new product features as they come out
Follow us